Solana SOL has reclaimed the $200 mark with a sharp 14.91% surge, drawing attention as traders eye a potential breakout towards higher targets.
After reclaiming the $200 level, Solana is showing renewed strength across both price action and on-chain activity. A sharp 14.91% jump in the past 24 hours has pushed the token back into the spotlight.
Solana Climbs Back to the $200 Mark
Solana has surged back to the $200 mark, a level that often acts as both a psychological and technical battleground. The rebound comes with a notable 14.91% gain in the past 24 hours, reflecting renewed bullish pressure and a shift in short-term sentiment. Price action shows a steady climb over the last day, suggesting that buying momentum has been persistent rather than reactionary, which is typically a stronger signal for trend continuation.
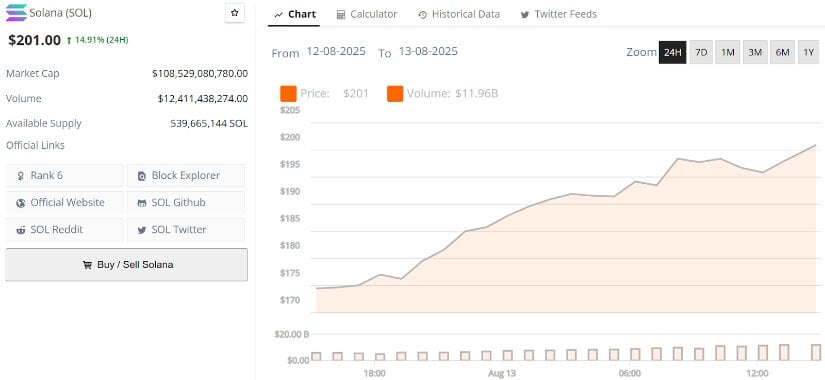
Solana is trading at around $201, up 14.91% in the last 24 hours. Source: Brave New Coin
From a technical perspective, holding above $200 could open the door for a retest of the $250 to $265 levels. If buyers maintain control through the coming sessions, Solana’s market structure could strengthen further, turning this recovery into the foundation for another leg higher in the ongoing bullish cycle.
Solana Price Prediction: 2023 Breakout Fractal Signals $250+ Move
Analyst Tommy B. points to Solana’s current setup as one that mirrors previous bullish continuation patterns. On the weekly chart, SOL is forming a clean ascending triangle structure right under the $200 to $205 resistance zone. This formation, coupled with higher lows pressing into a horizontal top, suggests that buying pressure is steadily building.
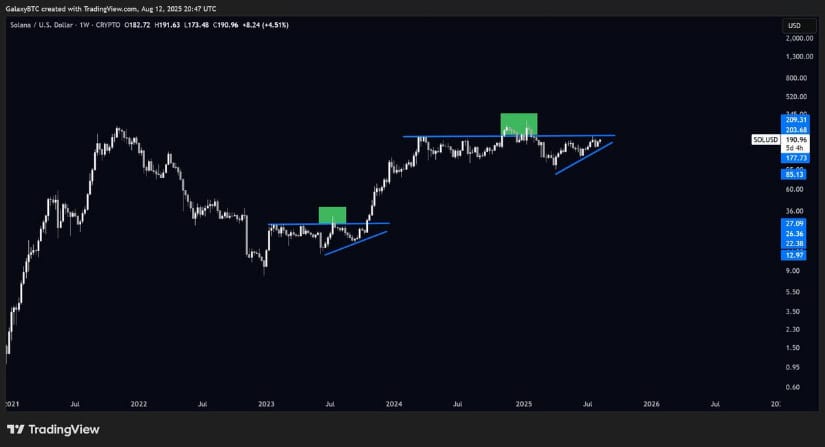
Solana forms an ascending triangle under key resistance, hinting at a potential breakout towards $250+. Source: Tommy B. via X
Historically, these structures tend to resolve upward when accompanied by rising volume, something the recent 14.91% surge already hints at.
From a technical standpoint, a confirmed breakout above $205 could quickly shift focus to the $250 to $265 range, aligning with prior market extensions following similar setups. The symmetry between the current pattern and earlier 2023–2024 breakouts strengthens the bullish narrative.
Solana On-Chains Growing Stronger as TVL Hits 3-Year High
According to the latest DeFiLlama data shared by SolanaFloor, Solana’s DeFi Total Value Locked (TVL) in $SOL terms has surged past 50 million SOL, reaching its highest level since mid-2022. This multi-year high reflects a sustained build-up through late 2024 and into 2025, closely resembling the early accumulation phases seen in previous cycles.
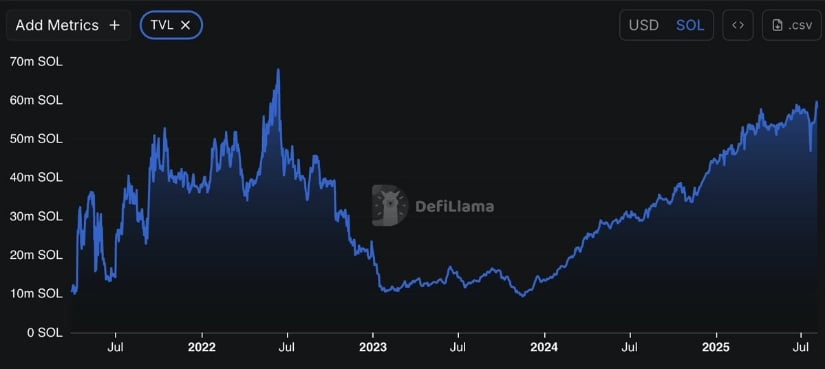
Solana’s DeFi TVL surpasses 50M SOL, marking its highest level since mid-2022. Source: SolanaFloor via X
From a technical perspective, such an extended TVL climb tends to provide a supportive backdrop for price rallies, as it signals both increased protocol activity and deeper liquidity across the ecosystem. With price action already reclaiming the $200 mark and technical setups pointing toward potential breakouts, this strengthening on-chain base could serve as a key driver for the upcoming upward leg.
Solana Price Momentum Strengthens as Trend Indicator Flips Green
Solana’s daily chart just saw a notable technical shift, with the Alpha Trend indicator flipping to green, signaling a transition in momentum. Price is currently pushing through the $197 zone, leaning on a backdrop of rising volume and a reclaim of key moving averages, including the EMA 20, 50, 100, and 200. This type of alignment often strengthens trend continuity, especially when it coincides with a break from prior congestion levels.
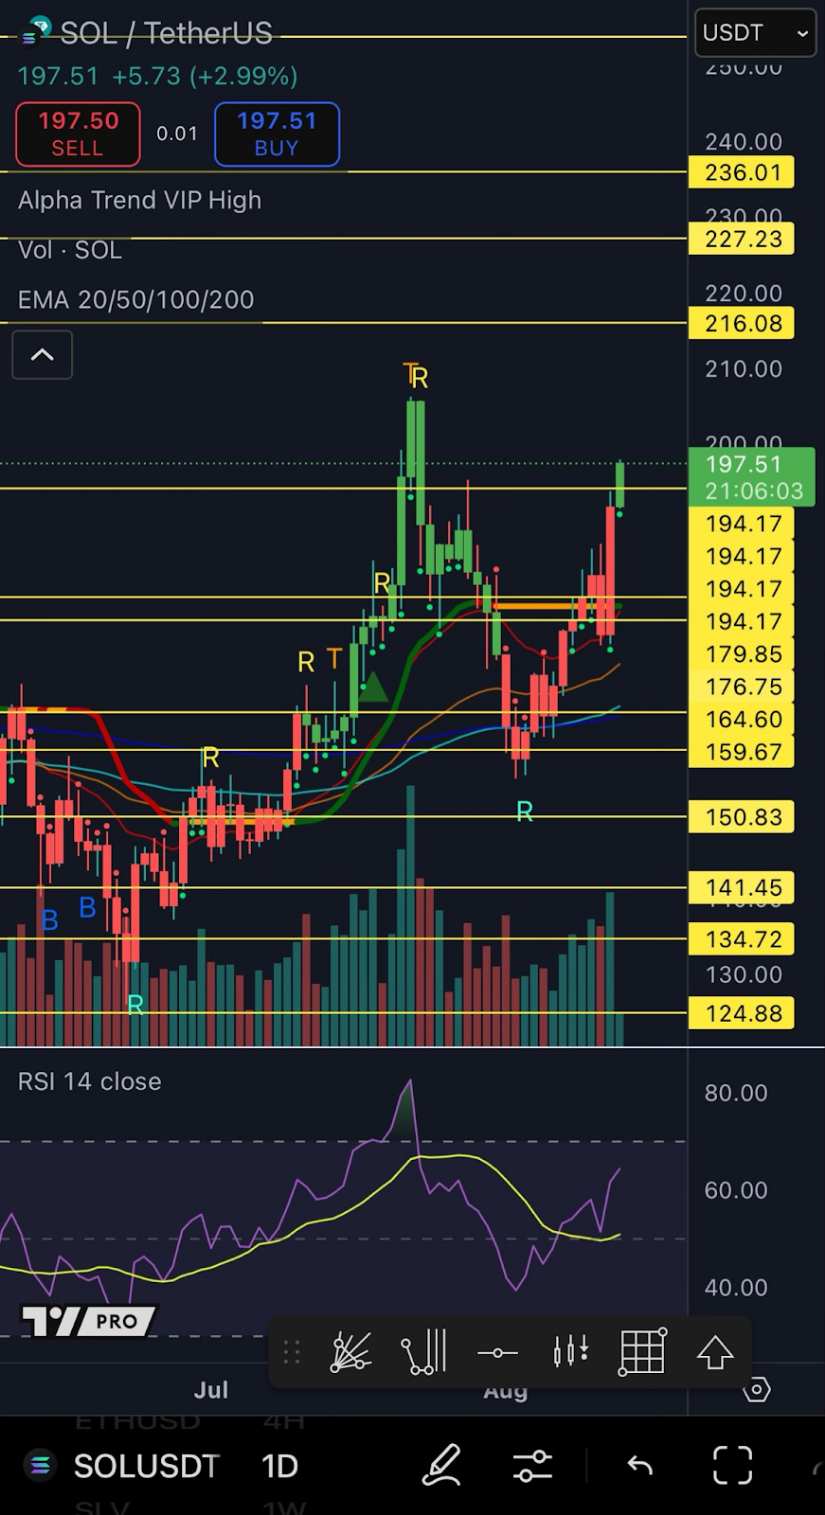
Alpha Trend flips green on Solana’s daily chart, with price eyeing resistance at $216 and $227. Source: ShardiB2 via X
This move builds on the recent reclaim of the $200 psychological level and the multi-year high in TVL, adding another layer of bullish context. ShardiB2’s technical chart shows multiple resistance levels now within reach, with $216 and $227 acting as the next notable checkpoints. If momentum sustains and the green trend flip holds into the weekly close, Solana could be setting the stage for an extended run towards the $236 to $240 region
Solana Technical Analysis
Solana is further showing a bullish confluence as its weekly chart structure aligns with multiple higher-timeframe breakout signals. Price action is now holding above a significant horizontal level, reinforcing the strength built from reclaiming $200 level.
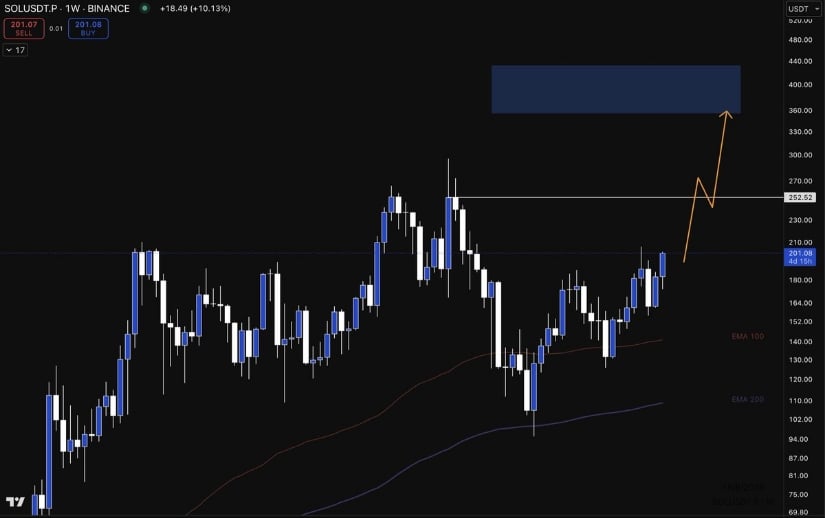
Solana’s weekly chart projects targets of $250 and $350 amid a strong bullish confluence. Source: Kiran Gadakh via X
The chart shared by Kiran Gadakh outlines a clean upward projection, with $250 positioned as the next major checkpoint and $350 as a potential extended target if momentum sustains. This structure, combined with the ongoing on-chain growth and previous indicator flips, provides a strong backdrop for continued upside.
Final Thoughts
Solana’s climb above $200 is supported by both strong technical patterns and improving on-chain activity. With DeFi TVL hitting its highest level in three years and multiple trend indicators turning bullish, buying momentum appears solid. The current chart structure shows strength, suggesting that this move is built on more than just short-term excitement.
If price continues to hold above key levels, targets around $250, and potentially higher, come into play.