- Bonk extends correction 35% below its July peak amid shaky sentiment in the broader crypto market.
- Bonk is retesting the Cup and Handle pattern’s neckline support ahead of a potential rebound.
- Interest in Bonk remains subdued as reflected by a decline in the futures Open Interest.
Bonk (BONK) is extending its decline from its July peak of $0.00004070, trading at around $0.00002606 on Thursday. While sentiment in the broader cryptocurrency market remains shaky after Bitcoin (BTC) hit a new all-time high of $124,474 earlier in the day and mildly pulled back, Bonk price could rebound after testing a critical Cup and Handle pattern’s neckline support.
Bonk declines amid suppressed open interest
Bonk’s derivatives market is on the back foot, characterised by the futures Open Interest (OI) shrinking to $38 million after peaking at approximately $73 million in July when the price hit a seven-month high of $0.00004074.
The persistent decline in OI, which refers to the notional value of outstanding futures or options contracts, implies low sentiment and interest in the Solana-based meme coin.
Still, with the futures-weighted sentiment remaining positive around 0.0101%, traders are increasingly leveraging long positions in BONK.
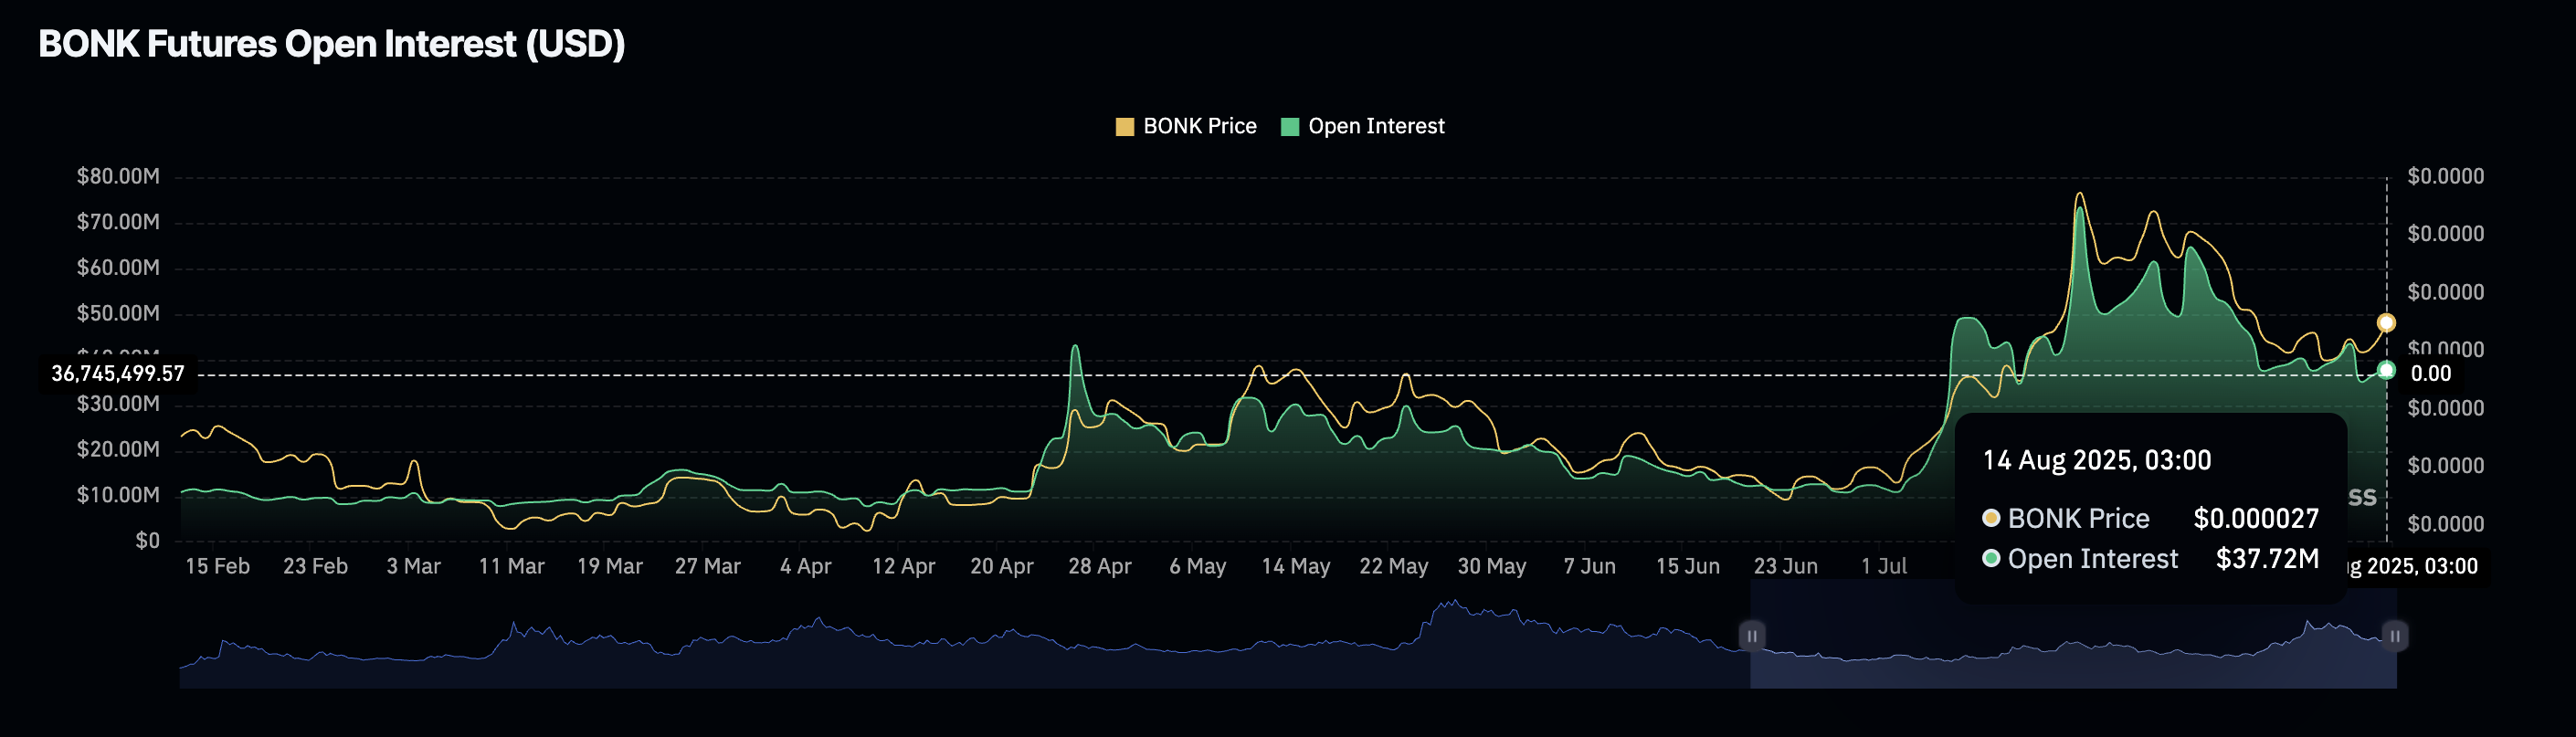
Bonk Futures Open Interest | Source: CoinGlass
Technical outlook: Bonk holds above key support
Bonk price upholds support at $0.00002563 provided by the 50-day Exponential Moving Average (EMA) as well as the Cup and Handle pattern’s neckline resistance-turned-support at around $0.00002500.
The meme coin also sits significantly above the 100-day EMA at $0.00002306 and the 200-day EMA at $0.00002174, backing its subtle bullish picture. These levels will serve as tentative support if the decline extends below the neckline support.
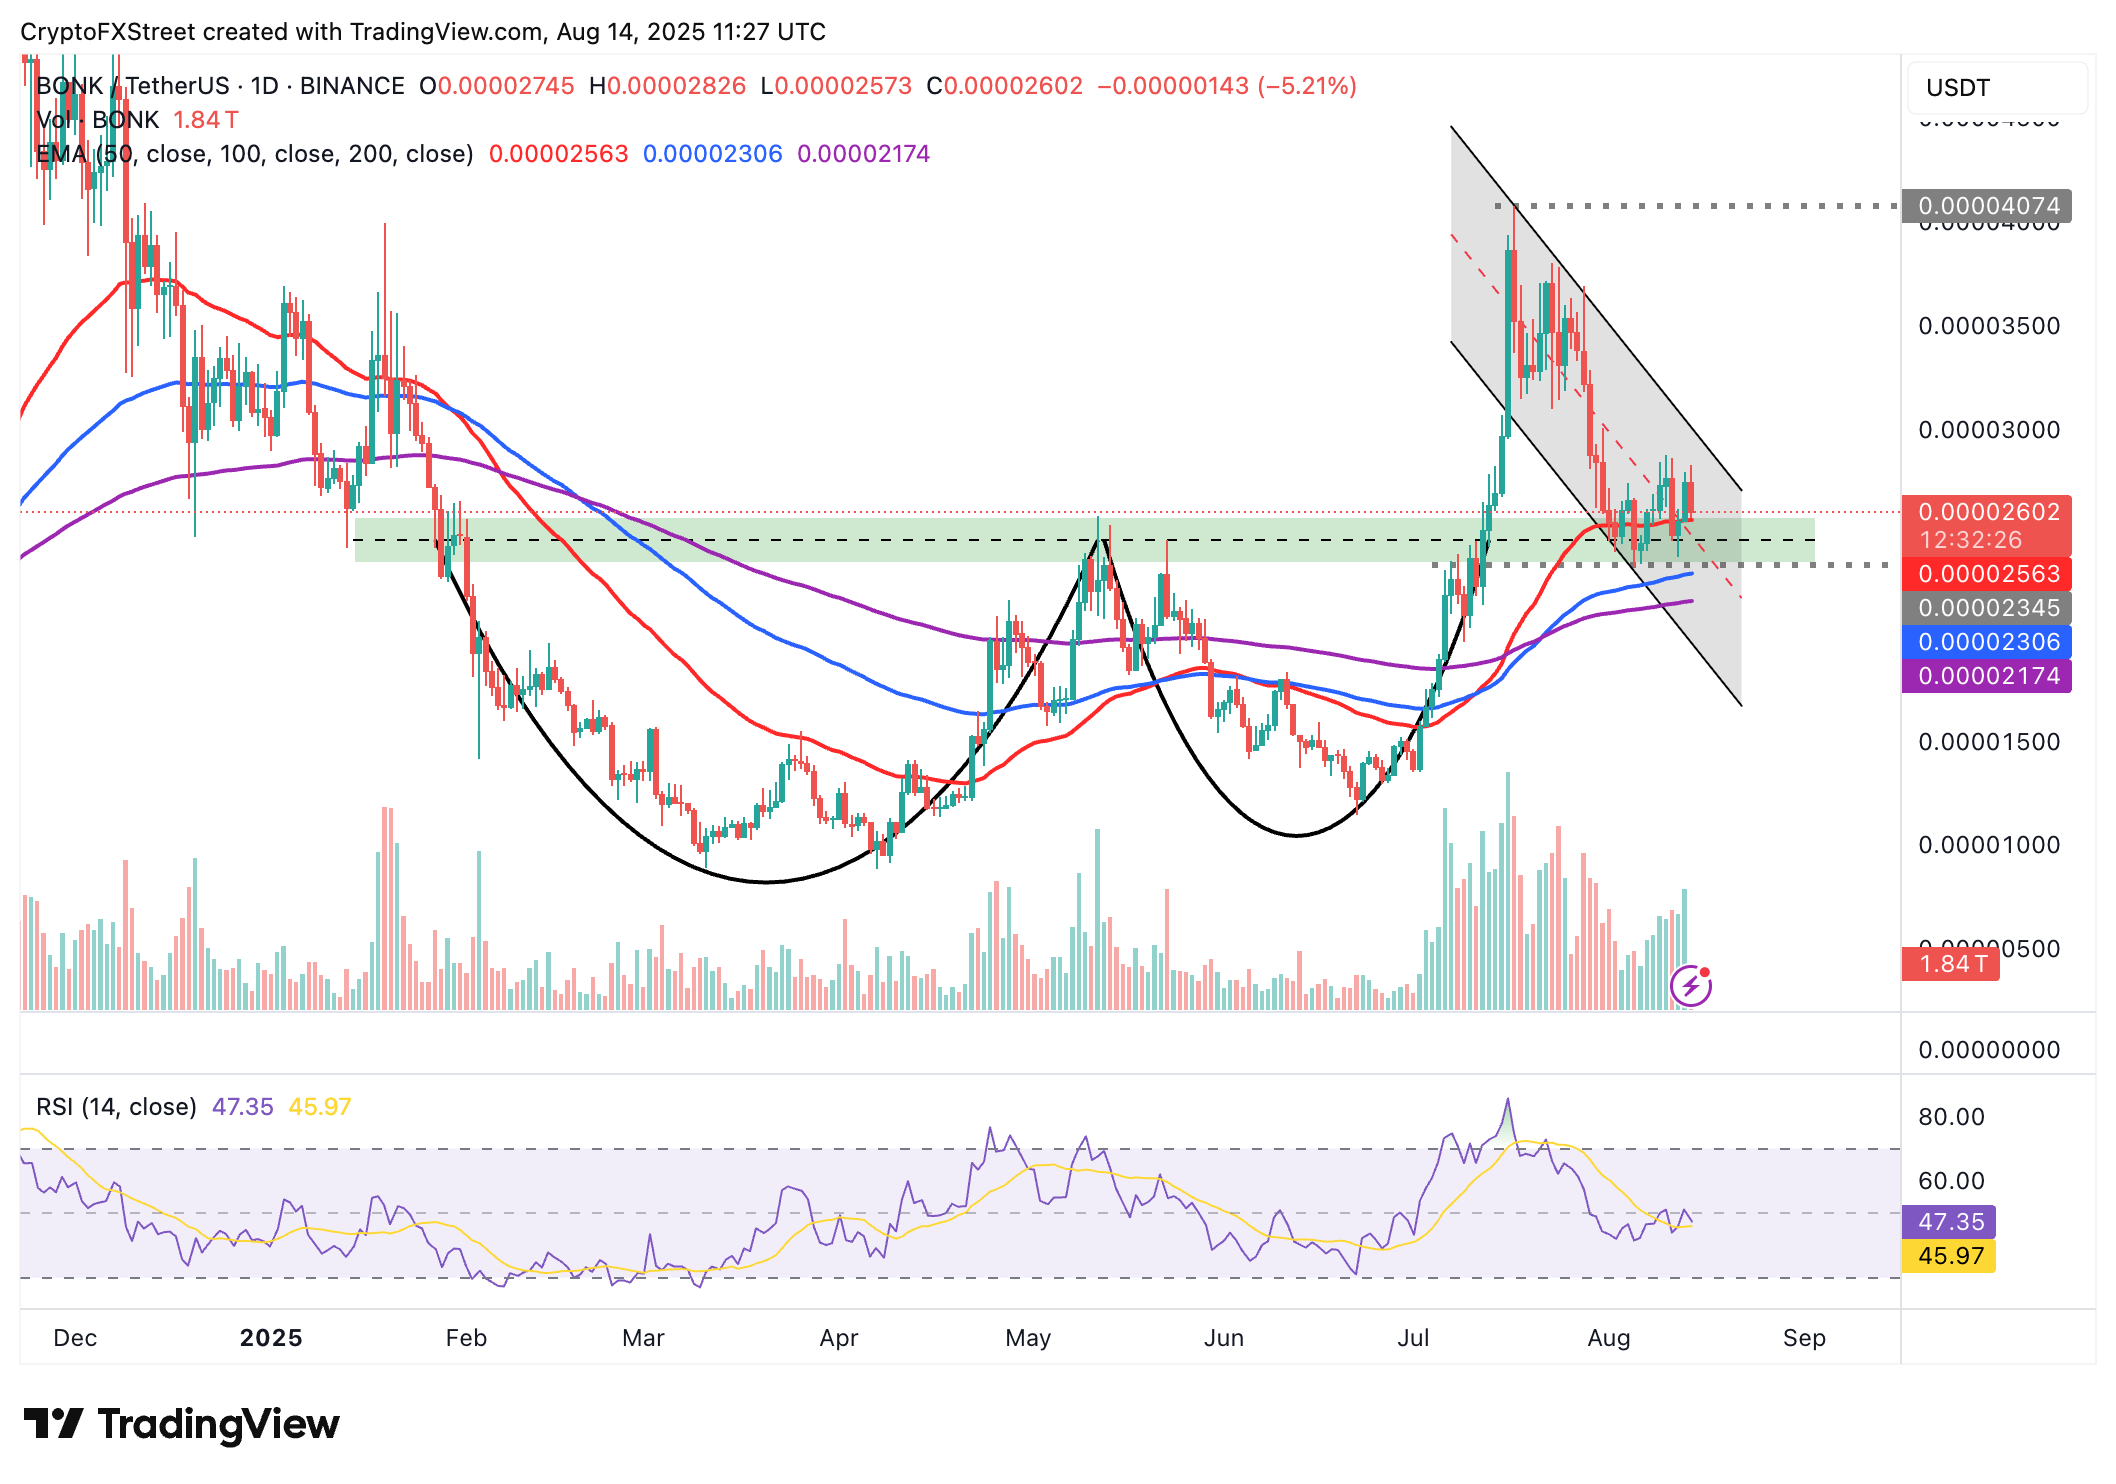
BONK/USDT daily chart
Two outcomes will likely follow Bonk’s testing of the neckline support: A bullish breakout aiming for the July peak of $0.00004074 and the extension of the down leg if the same support level gives way.
Traders should also focus on the Relative Strength Index (RSI), which continues to decline below the midline, indicating a reduction in buying pressure.