TLDR
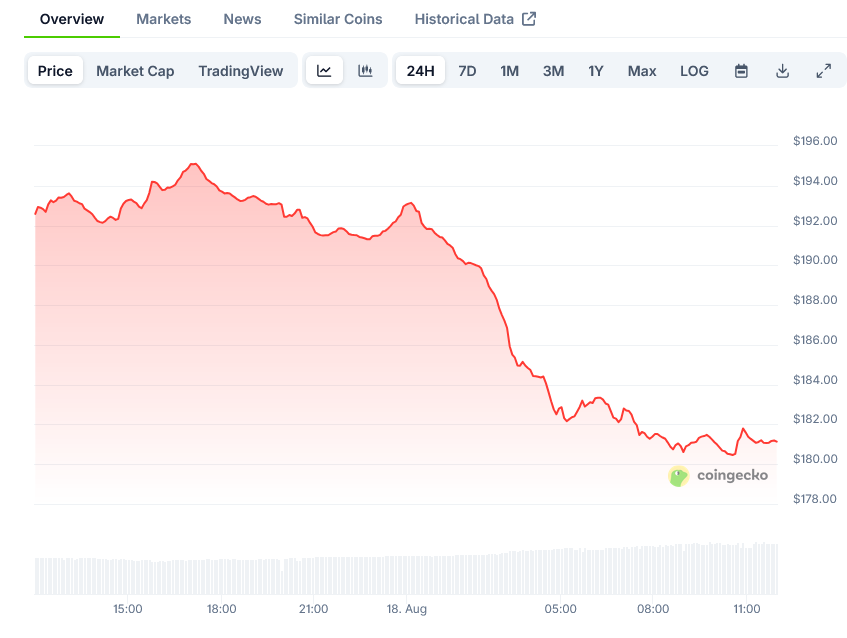
- Solana trading near $193, more than double its 2024 low
- REX-Osprey SOL + Staking ETF (SSK) has had seven consecutive weeks of inflows, now holding $183 million
- Solana’s monthly transactions jumped 31% to 2.44 billion
- Technical indicators suggest a potential breakout above $200 resistance
- Analysts predict SOL could reach $210-$218 within two weeks
Solana is making waves in the crypto market as its price holds steady near $193, a level that represents more than double its 2024 low. Though currently below its recent peak of $210, market indicators and growing investment in Solana-related products suggest the token could be poised for further gains.
The cryptocurrency has seen its 24-hour trading volume reach $3.6 billion, reflecting robust market interest.
A key driver behind Solana’s price movement is the growing popularity of the REX-Osprey SOL + Staking ETF (SSK). This investment vehicle has attracted $25.8 million in inflows last week alone, significantly higher than the previous week’s $3.5 million.
SSK has now recorded seven consecutive weeks of positive inflows. The total inflows have reached $164 million, bringing the ETF’s total assets to over $183 million.
This makes it one of the top-performing altcoin ETFs in the market today.
The SSK ETF differs from standard spot ETFs by allowing investors to benefit from both Solana’s price movement and staking rewards. Current data shows Solana’s staking yield has increased to 7.52%.
Network Growth Accelerates
Solana’s network metrics show impressive growth across multiple fronts. The supply of stablecoins on the Solana blockchain has increased by 6.2% over the past month, now exceeding $11.6 billion.
The adjusted transaction volume has grown by 6% to reach $186 billion.
Transaction activity positions Solana as one of the most active blockchains in the crypto space. Monthly transactions have surged by 31% to 2.44 billion, while the number of active addresses has climbed to over 90 million.
These metrics demonstrate Solana’s increasing adoption and utility within the broader crypto ecosystem.
From a technical perspective, Solana has established an ascending channel pattern on its daily chart. The token is currently trading slightly below the upper boundary of this channel.
A golden cross pattern has formed as the 50-day and 200-day moving averages have crossed, typically a bullish signal for continued upward movement.
Technical indicators present a mixed but generally positive outlook. The Relative Strength Index (RSI) sits at 51.50, in neutral territory that allows for movement in either direction.
The MACD histogram reading of 0.5014 suggests building bullish momentum despite recent price fluctuations.
Solana’s position within the Bollinger Bands at 0.59 indicates the token is trading above the middle band ($177.94) but below the upper resistance at $200.94. This positioning typically suggests consolidation before a directional move.
Price Targets and Predictions
Analysts have converged around several key price targets for Solana in the near term. The most immediate hurdle is the $200 resistance level, which represents a psychological barrier for traders.
A successful break above this level could open the path to the $210-$218 range within two weeks, according to multiple analyst forecasts.

The bullish case for Solana is supported by several technical factors. A cup-and-handle pattern identified by some analysts suggests potential movement to $218, representing a typical projection for this pattern formation.
Strong support from the 20-day simple moving average at $177.94 provides a foundation for this potential advance.
However, risks remain. Failure to reclaim the $200 level followed by a break below $177.94 support would activate a bearish scenario with a target of $172, representing a 6% decline from current levels.
For investors considering entry strategies, approaches vary based on risk tolerance. Conservative investors might wait for confirmation of a break above $200 before establishing positions, while more aggressive traders might consider accumulating on dips toward the 20-day moving average around $177.94.
The path forward for Solana will largely depend on its ability to break through the critical $200 resistance level in the coming days. With strong fundamentals and growing institutional interest through the SSK ETF, the technical setup favors a potential move toward the $210 target.
Solana’s price closed at $193 on Sunday, with expectations of increased volatility as it approaches the crucial $200 decision point.
