TLDR
-
Ethereum price bounced back 5% on Wednesday as whales accumulated 550K ETH.
-
Short liquidations reached $100 million as Ethereum’s price showed signs of recovery.
-
Large-scale holders increased their ETH stash, while small investors trimmed holdings.
-
Ethereum is eyeing $4,500 as it recovers from a market correction triggered by inflation concerns.
Ethereum price bounced off the $4,100 support level, showing resilience after recent market fluctuations. ETH price is currently trading around $4,287, following a minor retracement from the previous high of $4,290. Large-scale investors, commonly referred to as whales, have maintained strong buying pressure. Data shows these investors added over 550,000 ETH during the correction, highlighting confidence in the long-term trend.
The recent price movement has triggered short liquidations exceeding $100 million. These liquidations occurred after Ethereum briefly dipped below local support zones, which attracted buying from both whales and digital asset treasuries. Firms such as BitMine Immersion and SharpLink Gaming collectively purchased approximately 520,000 ETH in the past week.
Investor Behavior Supports Price Stability
While small-scale investors realized over $4 billion in profits during the correction, larger holders maintained their positions. This split in behavior indicates that long-term investors are confident, while retail traders are taking advantage of short-term gains.
Nicolai Sondergaard, research analyst at Nansen, noted, “A short-term retracement after a strong pump is normal. A 4–5% pullback is healthy and may prepare the market for further gains.”
This investor activity has helped stabilize Ethereum during a period of high volatility. The combination of whale accumulation and treasury purchases has absorbed selling pressure, allowing ETH to reclaim previously tested support levels.
Ethereum Technical Analysis Shows a Bullish Structure
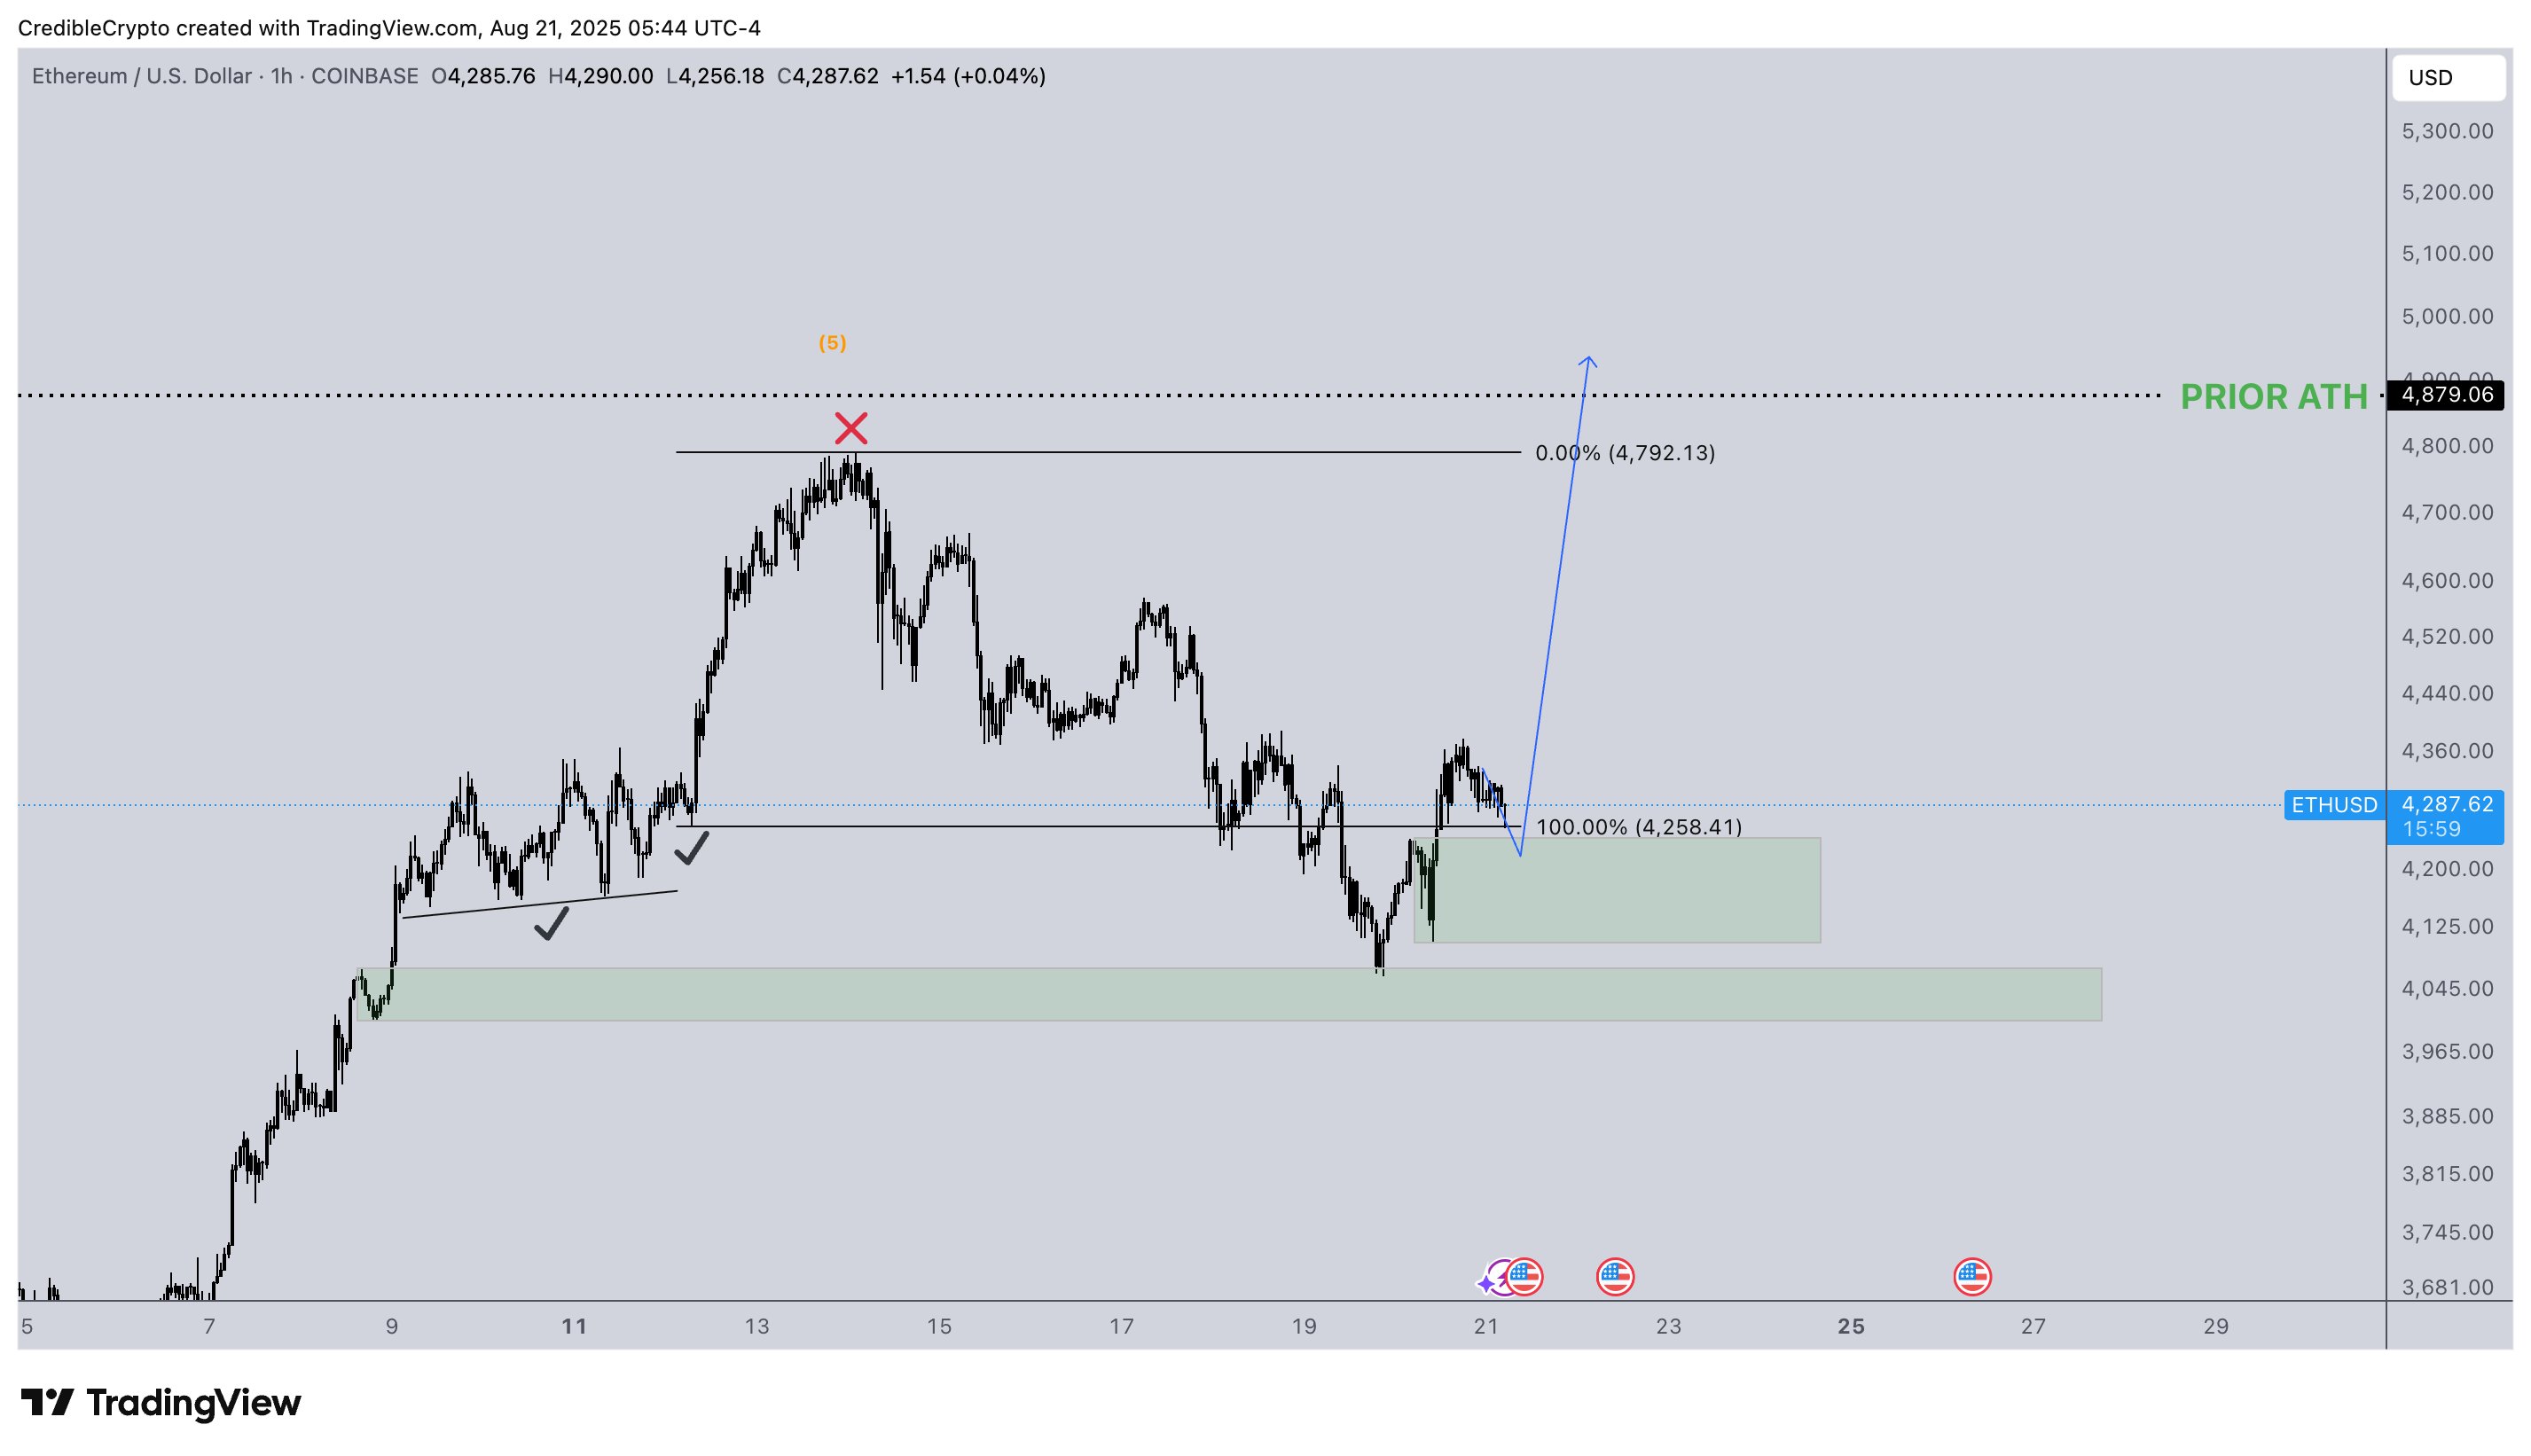
Ethereum price chart displays a clear upward trend with higher lows and higher highs. This structure suggests that buying pressure is consistently pushing the market higher. A significant support zone is located around $4,258, which aligns with a 100% Fibonacci retracement of the last major price swing. The support has consistently absorbed selling pressure, indicating confidence among buyers at this level.
- Source: X
A bullish divergence is visible on the chart. While ETH has formed higher lows in price, indicators such as the Relative Strength Index (RSI) made lower lows. This divergence typically signals the potential continuation of an upward trend, as market momentum strengthens even when short-term signals show temporary weakness.
Immediate resistance remains at the prior all-time high of $4,879. If Ethereum breaks above this level, targets between $4,950 and $5,000 could become achievable. Traders are also monitoring volume closely. A breakout with strong buying volume would reinforce the bullish sentiment and increase confidence in further upside.

ETH Price Potential Trend and Price Scenarios
Short-term chart analysis shows Ethereum price forming an ascending triangle pattern. The flat top corresponds to the previous all-time high, while the higher lows indicate increasing demand. Ascending triangles are generally considered bullish, and a breakout could lead to new highs if the support continues to hold.
Maintaining the $4,258 support is critical. If Ethereum price remains above this level and continues forming higher lows, the pattern suggests upward momentum could persist. Conversely, a drop below this zone might lead to a consolidation phase around $4,100–$4,200. Such a scenario would provide additional opportunities for buyers to step in before a potential upward move resumes.
High short interest in Ethereum futures further supports a possible short squeeze. If the price continues its upward trend, traders holding short positions may be forced to cover, accelerating the move toward higher levels.