Key Notes
- PENGU lost 9% in a day, now trading near $0.031.
- Analyst Ali Martinez sees a potential rally to $0.10 if the bullish pattern holds.
- Support sits at $0.0300, with resistance at $0.0403–$0.0466.
The fourth-largest meme coin by market cap, Pudgy Penguins’ native cryptocurrency PENGU
PENGU
$0.0316
24h volatility:
8.1%
Market cap:
$1.99 B
Vol. 24h:
$529.80 M
, fell sharply today amid the broader crypto market downturn. At the time of writing, PENGU is trading at around $0.031, marking a 9% daily drop.
However, popular crypto analyst Ali Martinez believes this correction may be the best time to buy one of the top meme coins. Notably, PENGU has been forming a bullish flag channel on the 4-hour chart since August 9, a setup that often leads to major upward moves.
$PENGU is inches away from a new leg up — $0.10 next! pic.twitter.com/dlk4slbOrS
— Ali (@ali_charts) August 25, 2025
If confirmed, the token could rally as high as $0.10, representing a potential 300% gain.
PENGU Price at Crossroads
PENGU saw a major price rally between April and mid-July, surging around ten times during this time. However, since then, it has been consolidating inside a descending channel that began in mid-July.
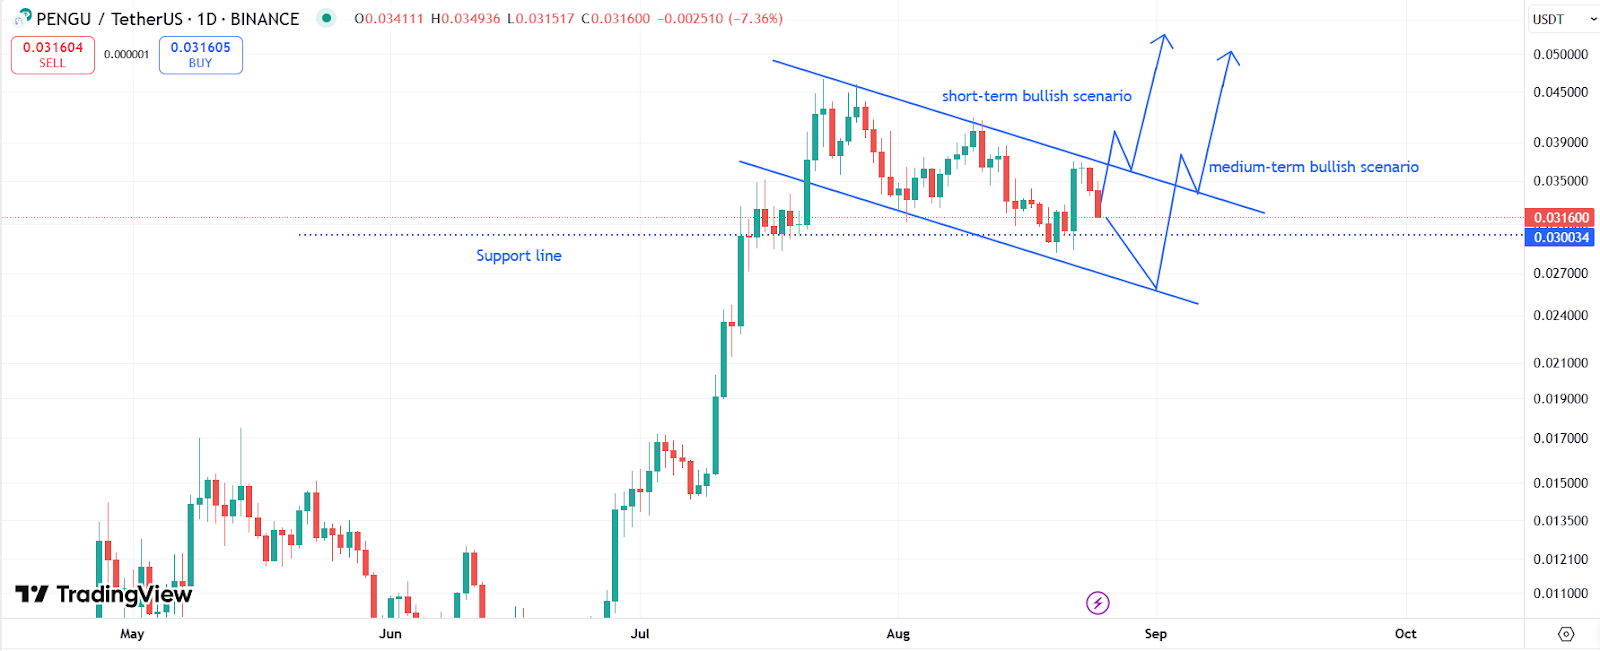
PENGU is currently testing the $0.030 support zone, which also aligns with a broader $0.025–$0.030 demand range. If the cryptocurrency fails to hold above $0.030, the next key support lies at $0.025, which could lead to further downside.
According to the data by CoinMarketCap, PENGU price is down 25% in the past month, losing over $700 million in market cap.
If the meme coin manages to break out from this descending channel, traders should watch for immediate resistance at $0.0403. A decisive close above this level will confirm the beginning of a new uptrend.
The RSI is currently indicating neutral conditions on the daily chart. PENGU’s overall price action currently depends on the $0.030 support zone. Holding above this level could confirm a breakout toward $0.046 and beyond, while failure risks a drop to $0.025.
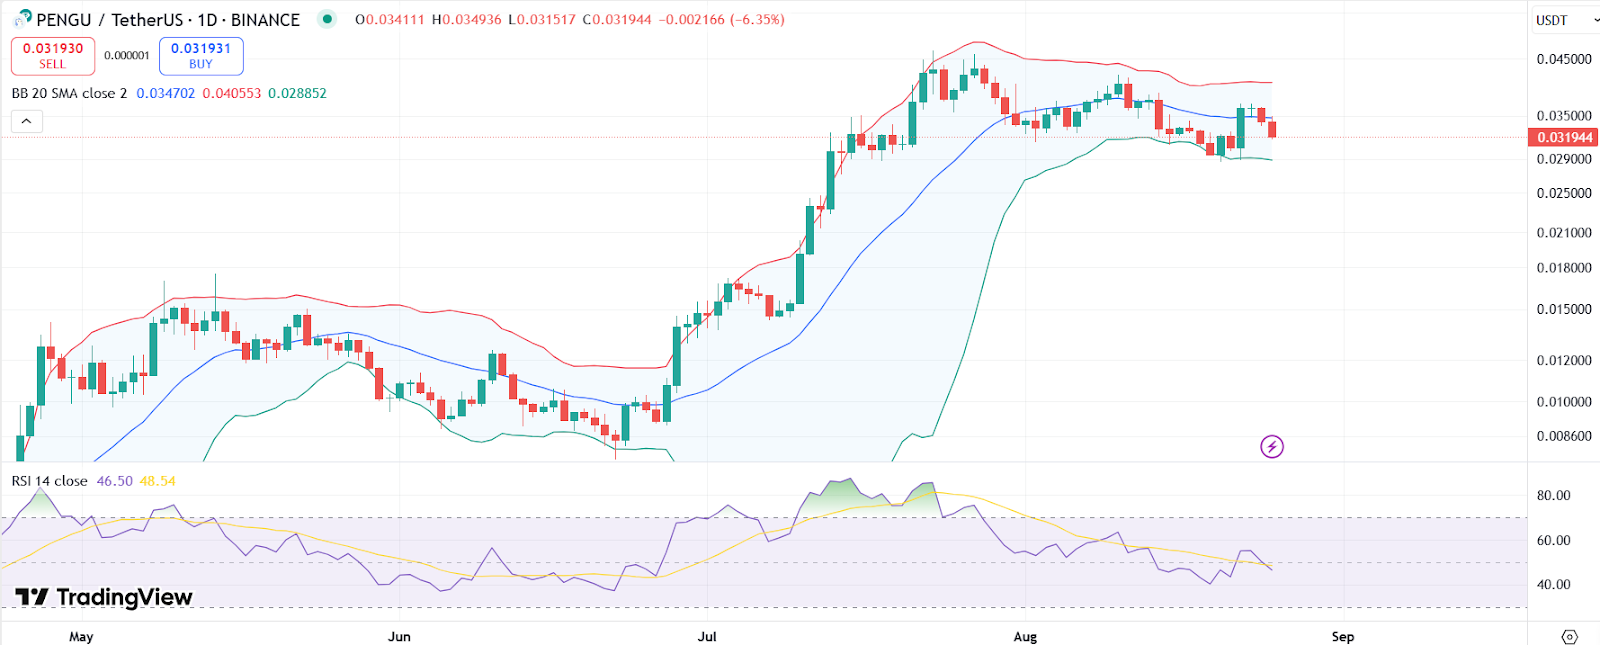
PENGU price chart with RSI and Bollinger | Source: TradingView
The price is approaching the lower Bollinger Band, which often points to a potential rebound if buyers defend this level. However, persistent weakness could see the meme coin drifting even lower.
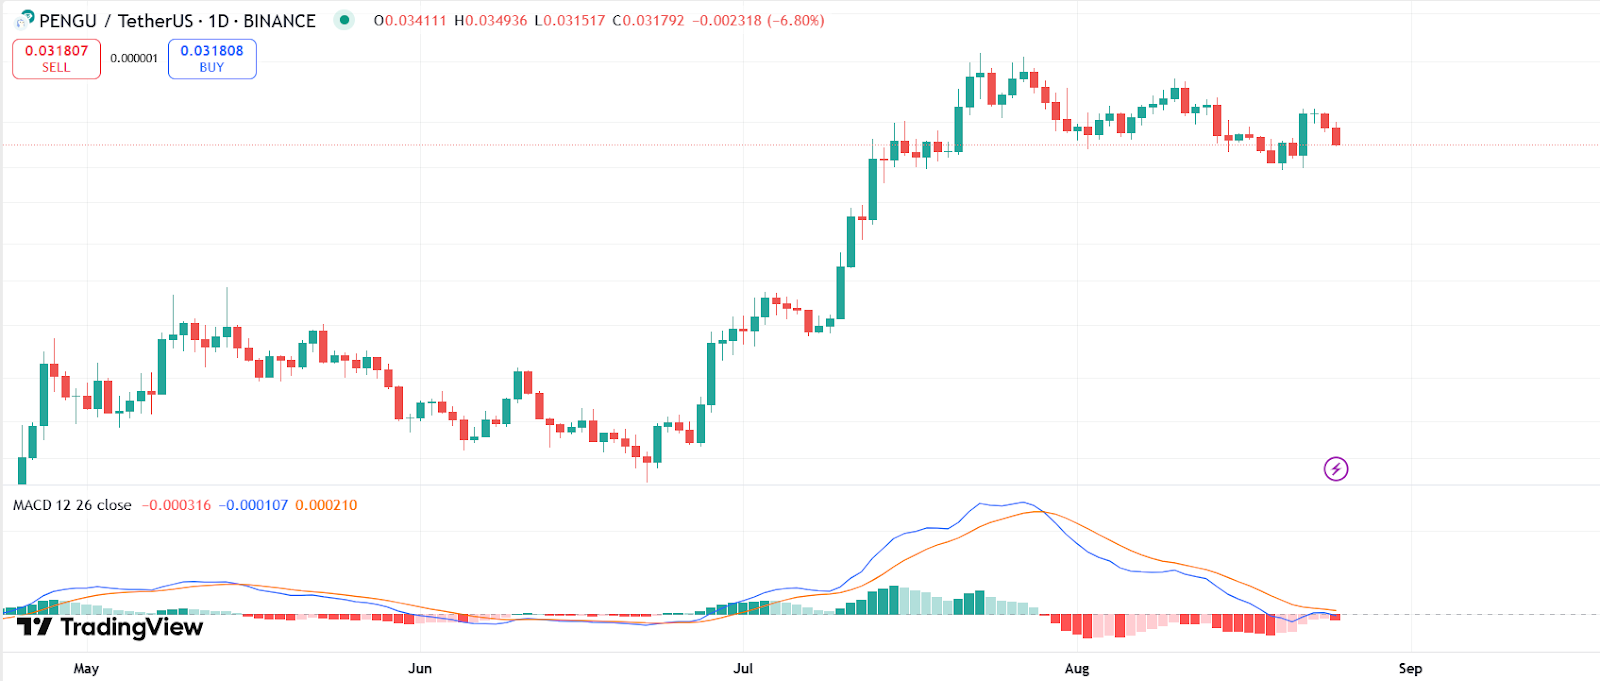
PENGU price chart with MACD | Source: TradingView
The MACD histogram shows red bars, with the signal line above the MACD line. This suggests bearish momentum is still present, but the line positions suggest a crossover could quickly shift the trend bullish.
Disclaimer: Coinspeaker is committed to providing unbiased and transparent reporting. This article aims to deliver accurate and timely information but should not be taken as financial or investment advice. Since market conditions can change rapidly, we encourage you to verify information on your own and consult with a professional before making any decisions based on this content.

A crypto journalist with over 5 years of experience in the industry, Parth has worked with major media outlets in the crypto and finance world, gathering experience and expertise in the space after surviving bear and bull markets over the years. Parth is also an author of 4 self-published books.