
For those short on time, here are the key takeaways from this week’s crypto analysis:
- Fed Rate Cut Hints Fuel Market-Wide Surge: The primary driver for the recent rally is Jerome Powell’s dovish tone, creating a “buy the rumor” environment across crypto and stocks.
- Ethereum on the Brink of a New All-Time High: ETH is just inches away from its historic peak, but on-chain data shows its valuation is entering a “danger zone,” signaling potential for a pullback.
- Bitcoin Shows Worrying On-Chain Signs: Despite price stability, the amount of Bitcoin held on exchanges is rising, a trend that has historically preceded selling pressure.
- Altcoin Market Highlights: Chainlink is decoupling from the market with a new year-to-date high, while the dramatic rise and fall of Kanye West’s Yeezy memecoin offers a stark reminder of market volatility (and stupidity.)
Welcome to our summary of the August 22, 2025 This Week in Crypto market analysis. In this session, Brian broke down a market buzzing with activity, driven by powerful macroeconomic signals and standout performances from top crypto assets. We explored why Ethereum is knocking on the door of a new all-time high, what Jerome Powell’s latest speech means for your portfolio, and the wild, cautionary tale of Kanye West’s $3 billion memecoin. Here’s a data-driven look at the forces shaping the crypto market.
The market is showing incredible strength, with Ethereum leading the charge. Brian noted that ETH reached $4,834, just shy of its long-standing all-time high of $4,866(at the time of the call.) This move put the entire crypto community on high alert for a potential historic breakout. Meanwhile, Bitcoin is consolidating, hovering around $117,000 while aiming to reclaim the $120,000 mark. Another major story is Chainlink, which has been on a huge run, exciting its community with a strong “decoupling” from the broader market trends.
The primary driver behind the recent market surge was a speech from Fed Chair Jerome Powell. During his Jackson Hole address, Powell hinted at a potential rate cut, stating that the “shifting balance of risks may warrant policy adjustments.” This was widely interpreted as dovish, signaling easing monetary policy ahead. This news immediately sparked optimism across financial markets, with crypto pricing in the potential stimulus in a clear “buy the rumor” scenario.

- Key Data: Powell’s Jackson Hole speech was interpreted as dovish, with markets now anticipating a potential rate cut in September.
- Actionable Tip: Keep a close eye on official Fed announcements, as the market’s current rally is heavily dependent on this macroeconomic narrative.
The connection between crypto and traditional finance is stronger than ever. Brian pointed out that the S&P 500 also made a new all-time high, reinforcing the bullish sentiment. Since early 2022, crypto has become highly correlated with global stock markets. Charts shown during the stream revealed that Bitcoin, the S&P 500, and even gold have been moving up in tandem in response to dovish news from the Fed.
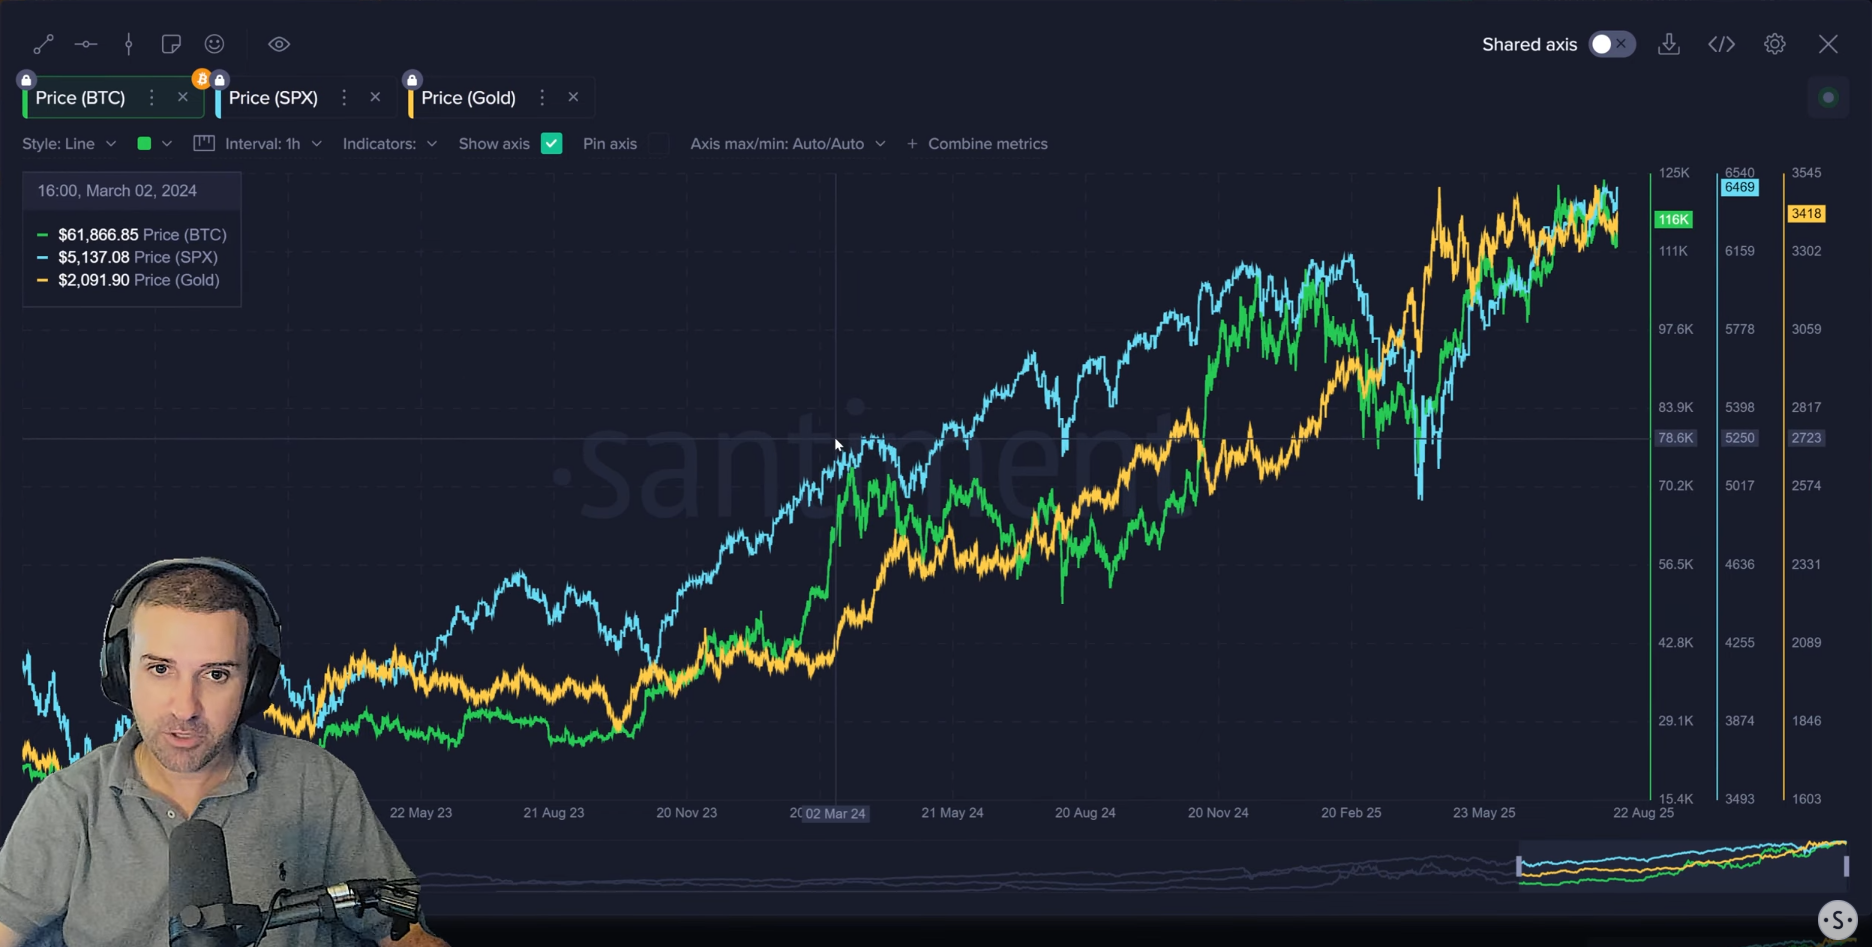
- Key Data: The S&P 500 reached a new all-time high, moving in tandem with Bitcoin and gold.
- Actionable Tip: Watch the S&P 500’s performance as a potential leading indicator for short-term crypto market sentiment due to the high correlation.
Shifting from macroeconomics to market mania, Brian covered the explosive rise and fall of the Yeezy memecoin. Allegedly launched by Kanye West on the Solana blockchain, the coin skyrocketed to a $3 billion market cap before plummeting back below $1 billion. This event serves as a powerful reminder of the volatility in the memecoin space, with the key takeaway being “buyer beware.”
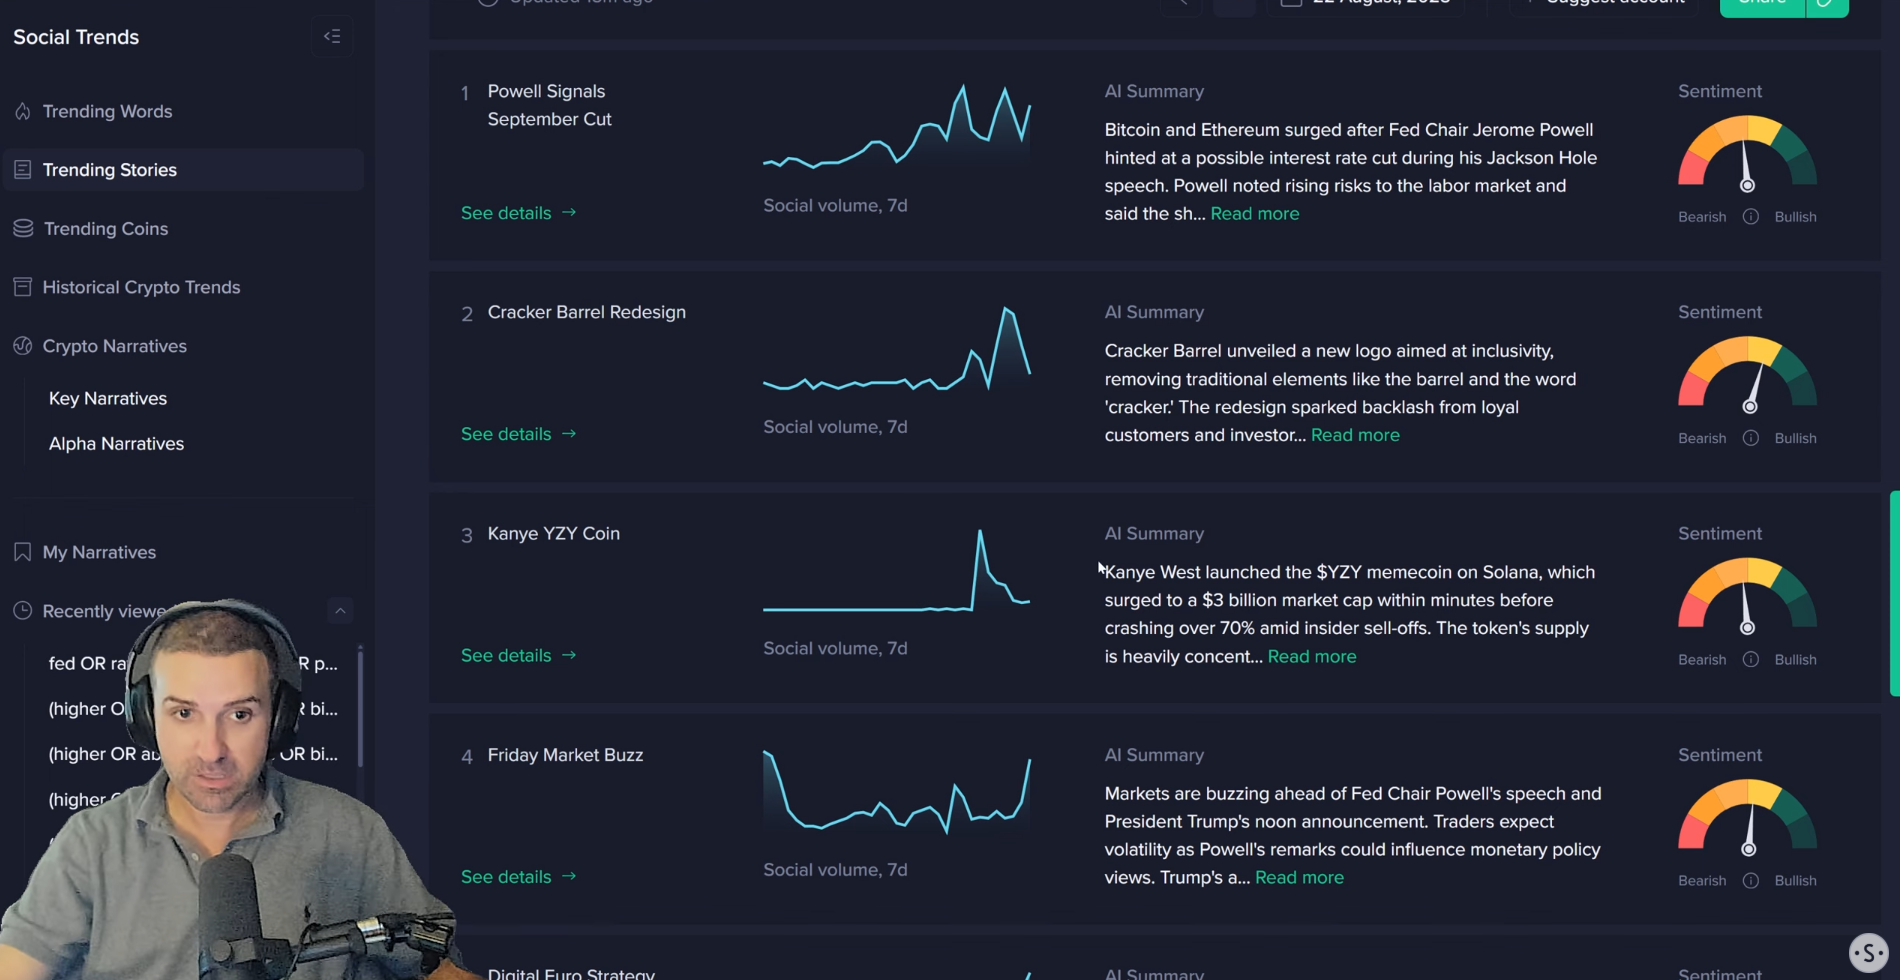
- Key Data: The Yeezy memecoin peaked at a $3 billion market cap before crashing, causing losses for over 56,000 wallets.
- Actionable Tip: When evaluating celebrity memecoins, check on-chain data for wallet distribution and initial holder activity to better gauge potential risks.
Market sentiment provides fascinating clues about future price action. Before the recent rally, social media sentiment had turned extremely negative, hitting its lowest point since early July. Retail traders had become frustrated after trying to “buy the dip” without seeing an immediate recovery. This wave of negativity served as a classic contrarian indicator, signaling a market bottom was near just before the strong bounce.
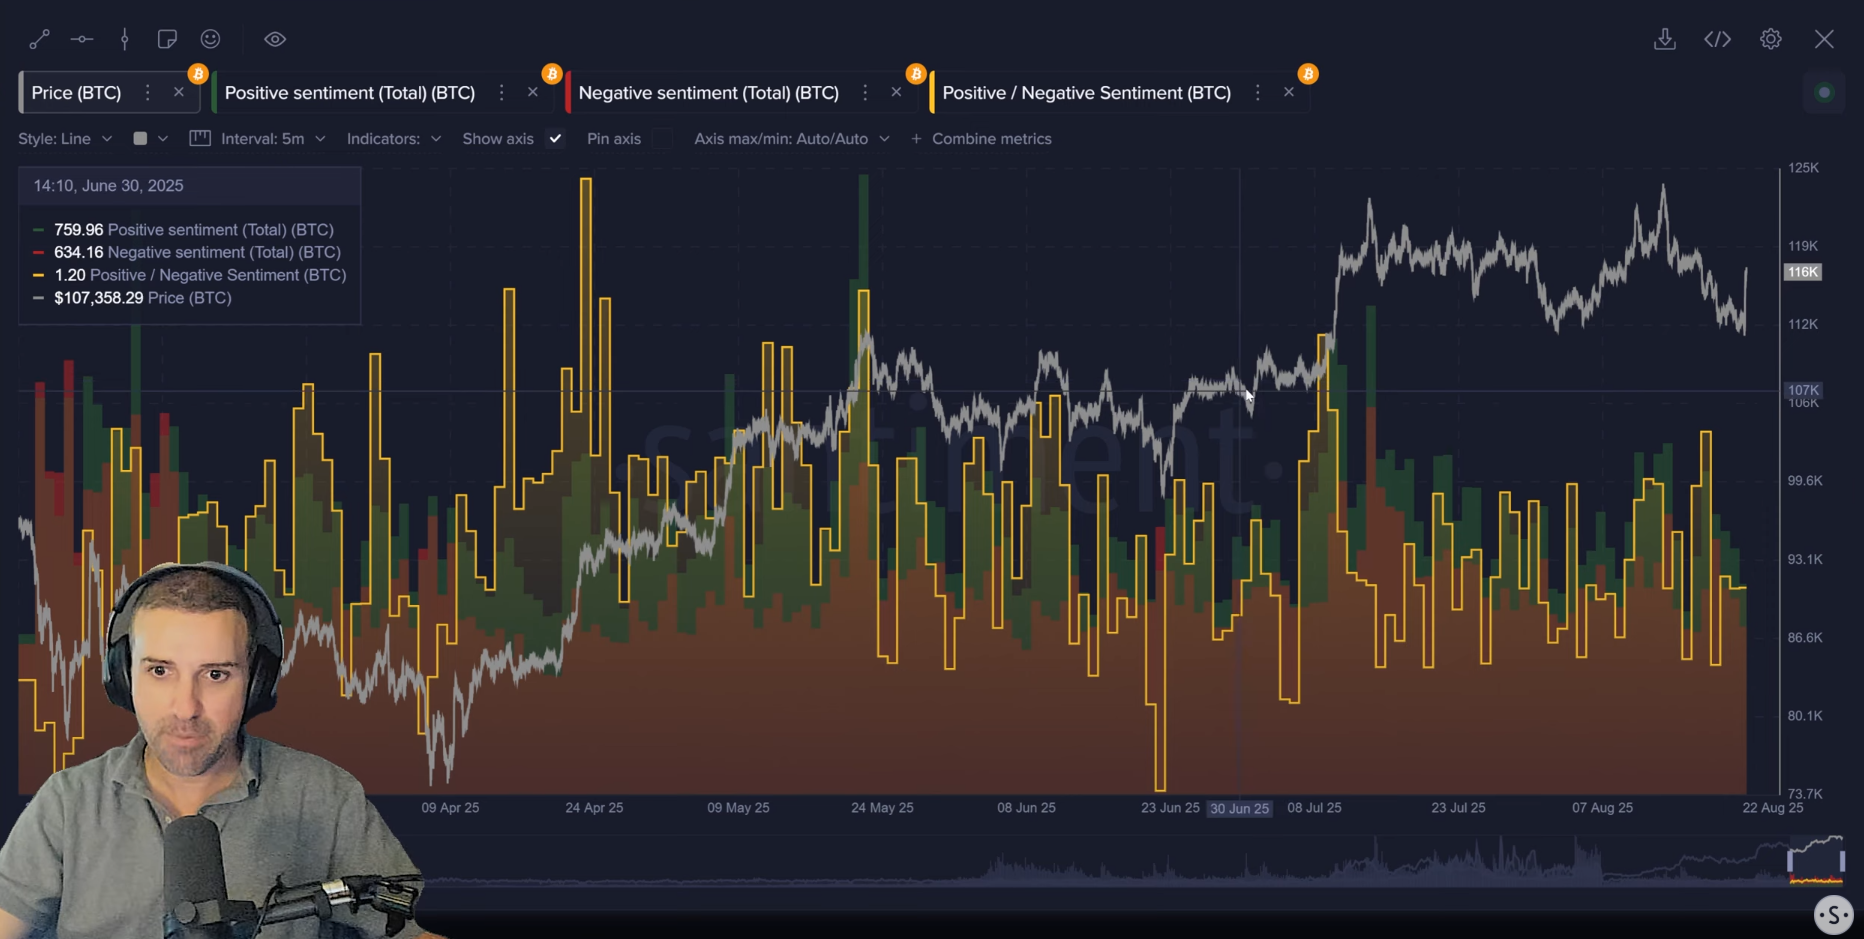
- Key Data: Social sentiment reached its most negative level since early July right before the market began its recovery.
- Actionable Tip: Analyze social sentiment with tools like metrics and the various social trend features offered on Sanbase to identify moments of extreme fear or greed, as these often act as contrarian signals for market reversals.
While optimism about a rate cut is fueling the market, social data suggests caution is warranted. Mentions of keywords like “Fed,” “rate,” and “cut” across social platforms have surged to an 11-month high. Historically, such a massive spike in discussion around a single bullish narrative can indicate that euphoria is getting too high and may signal a local top.
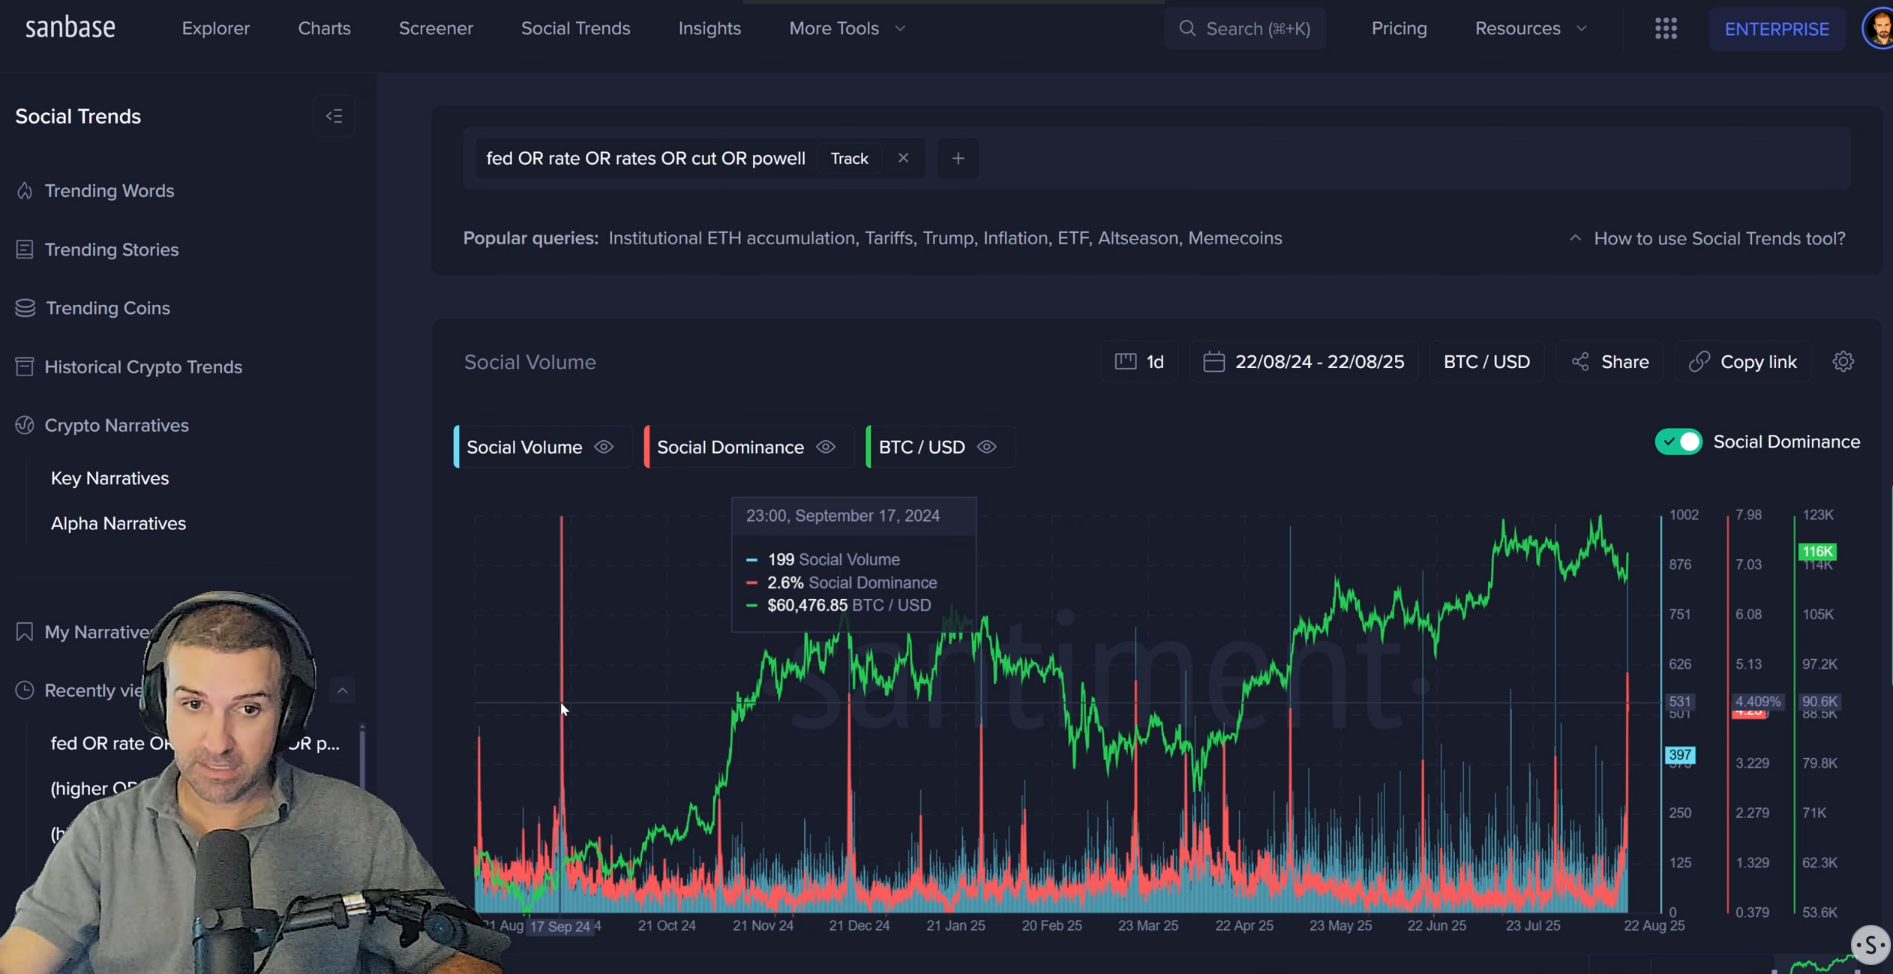
- Key Data: Social media discussion related to a Fed rate cut has hit its highest point in 11 months.
- Actionable Tip: Track the social dominance of macro-related keywords; a significant spike can indicate market euphoria and a potential need for caution.
The analyst shared a unique sentiment metric(see first chart in this link) that tracks the ratio of comments discussing prices going “higher” versus “lower.” For Bitcoin, there is a growing bias toward “higher,” a pattern that has sometimes preceded price corrections. Interestingly, the same metric for Ethereum shows that conversations are still relatively dormant, suggesting ETH may still have room to run before becoming overhyped.
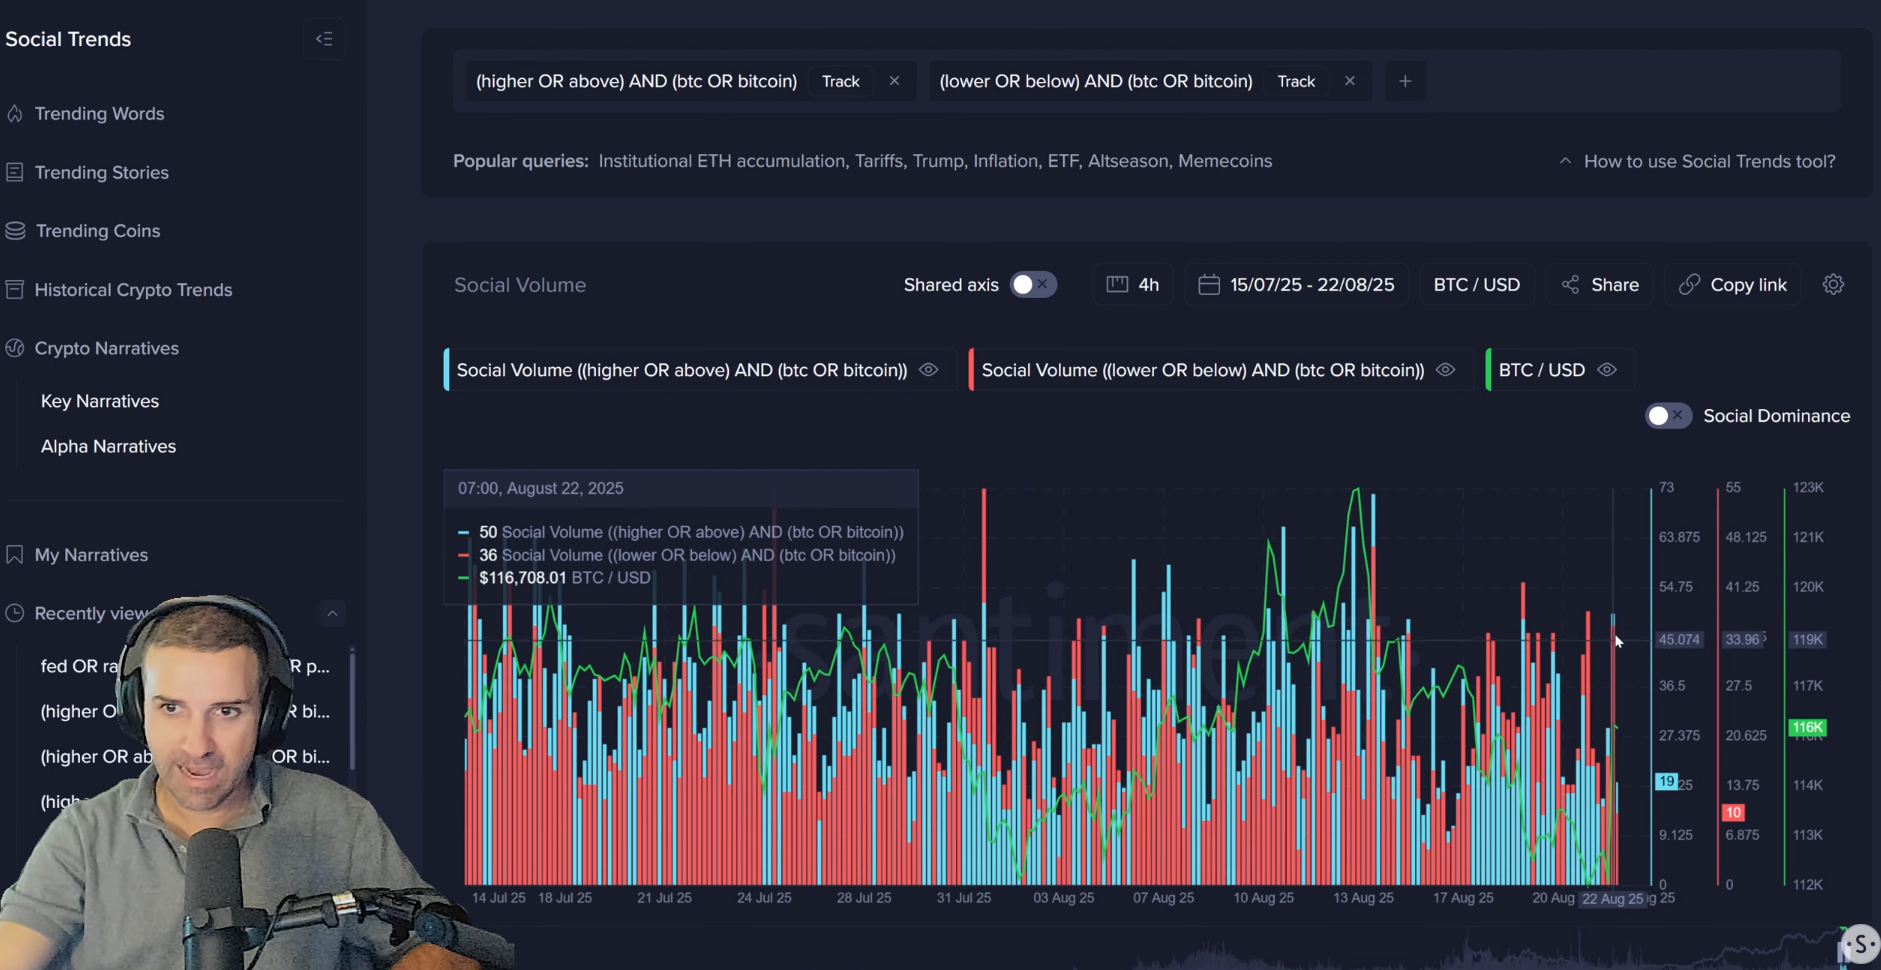
- Key Data: Bitcoin is seeing a rising number of “higher” price predictions on social media, while Ethereum discussions remain neutral.
- Actionable Tip: For Ethereum, watch for a sharp increase in social media posts predicting “higher” prices after an ATH break, as this could signal retail FOMO is peaking.
A look at Bitcoin’s on-chain data reveals a neutral-to-cautious picture. Key utility metrics like daily active addresses and transaction volume have cooled off. The long-term MVRV ratio, which measures holder profitability, sits at +18.5%, indicating a slightly risky zone for new long-term investments. Additionally, positive funding rates show traders are increasingly betting on higher prices.
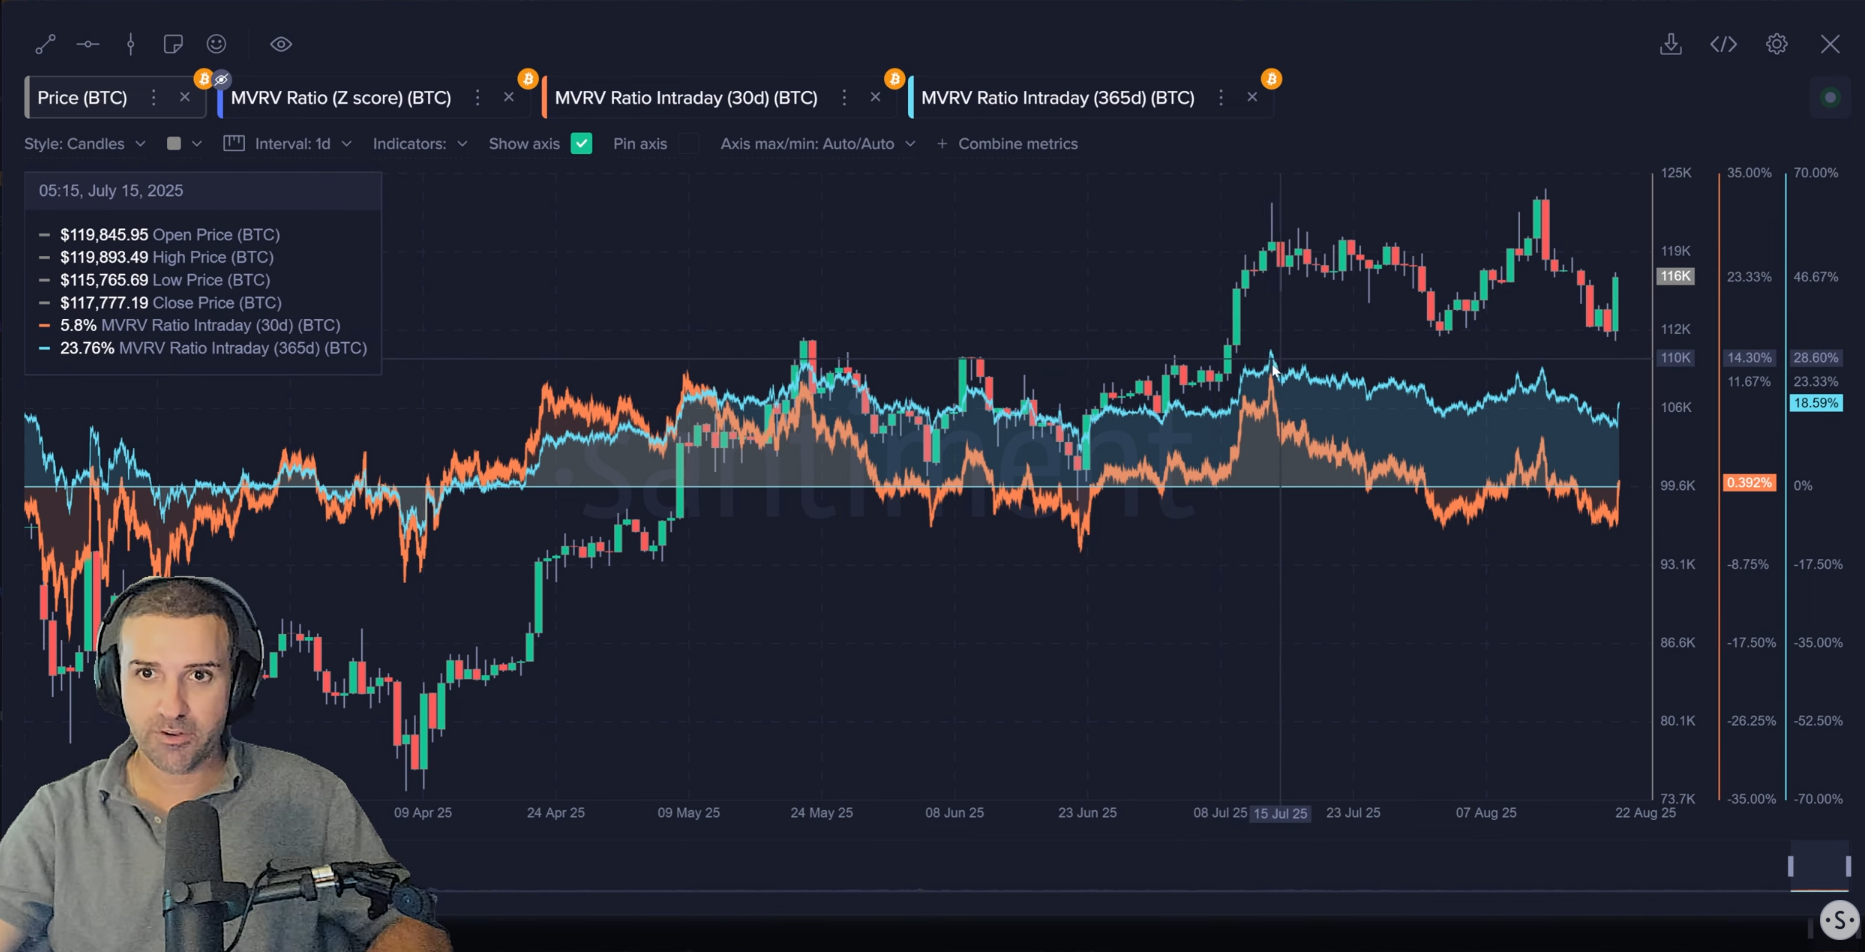
- Key Data: Bitcoin’s long-term MVRV is at +18.5%, and funding rates on exchanges like Binance are positive.
- Actionable Tip: Combine MVRV data with funding rates; a high MVRV plus heavily positive funding rates can suggest an overheated market vulnerable to a long squeeze.
One of the more concerning on-chain trends for Bitcoin is its rising supply on exchanges. Since early June, the amount of BTC held on exchanges has increased by nearly 70,000. This is a notable shift from the long-term trend of coins moving into cold storage and can indicate that more holders are positioning themselves to sell.
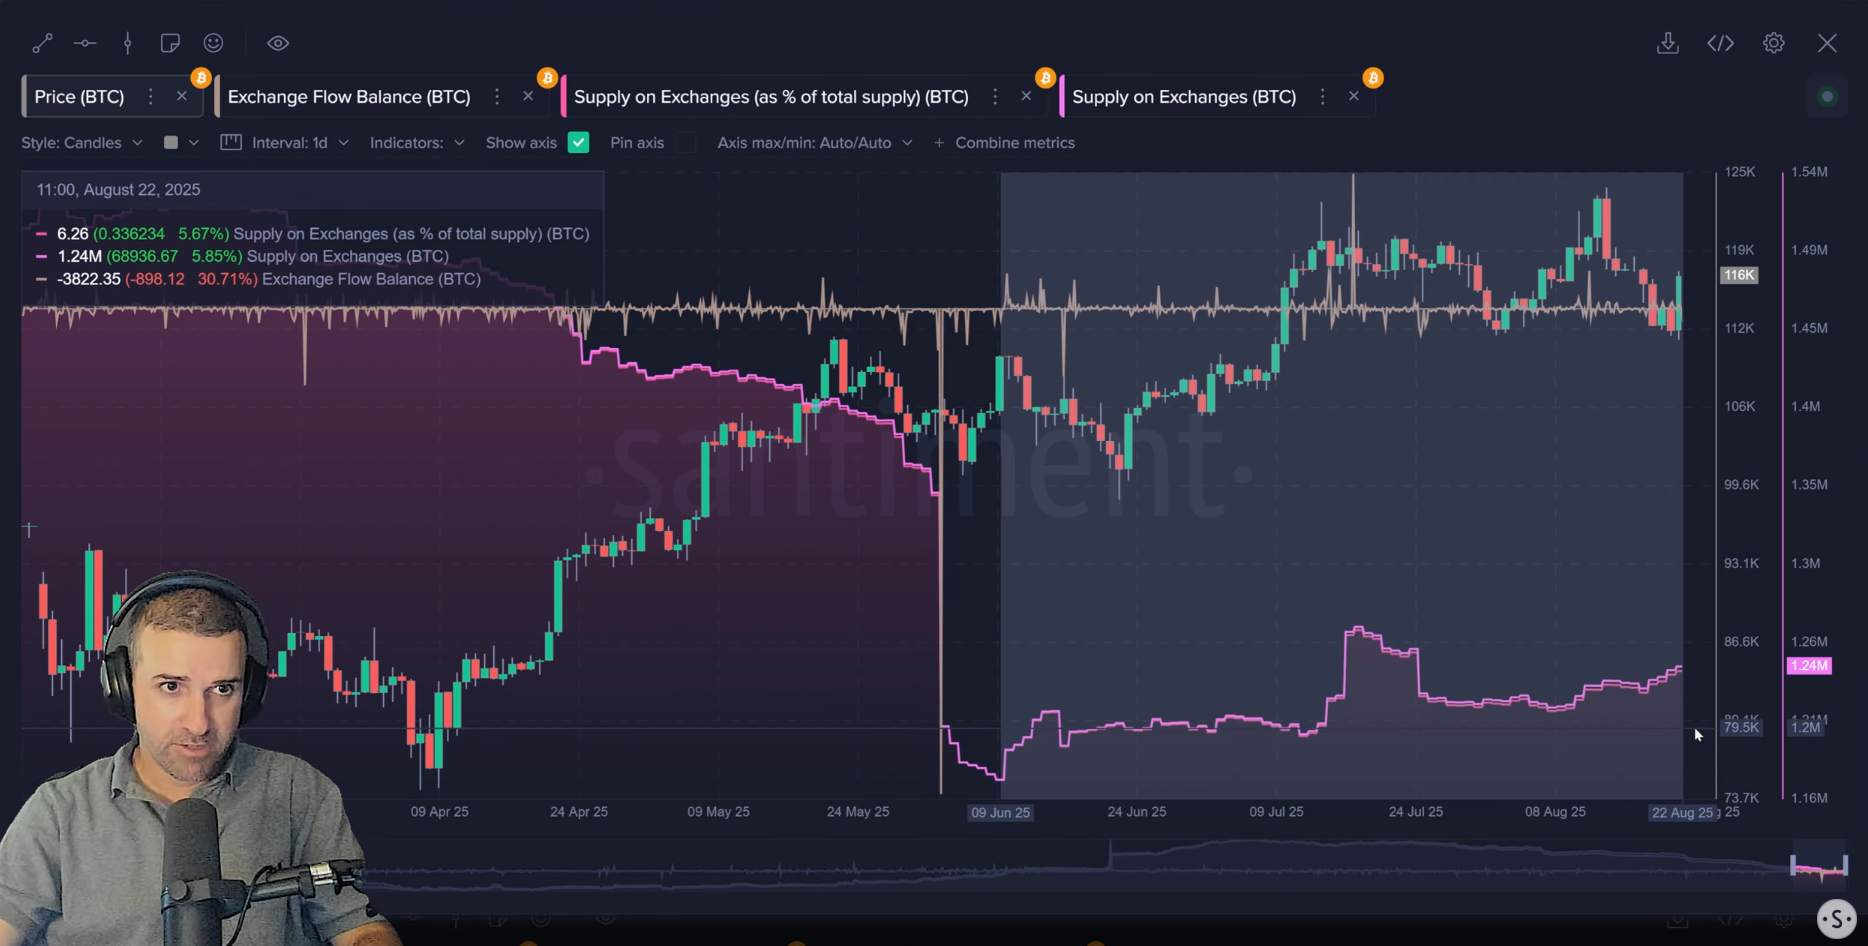
- Key Data: Bitcoin on exchanges has increased from 1.17 million to 1.24 million since June 9th, a rise of nearly 70,000 BTC.
- Actionable Tip: Regularly check the “Supply on Exchanges” metric for Bitcoin; a sustained increase can signal potential selling pressure and act as a headwind for price.
While Ethereum’s price action is exciting, its MVRV ratio signals a need for caution. The short-term (30-day) MVRV is approaching +15%, a level identified as a “danger zone” where altcoins often experience pullbacks. Even more striking is the long-term MVRV at a very high +58.5%, increasing the risk of profit-taking.
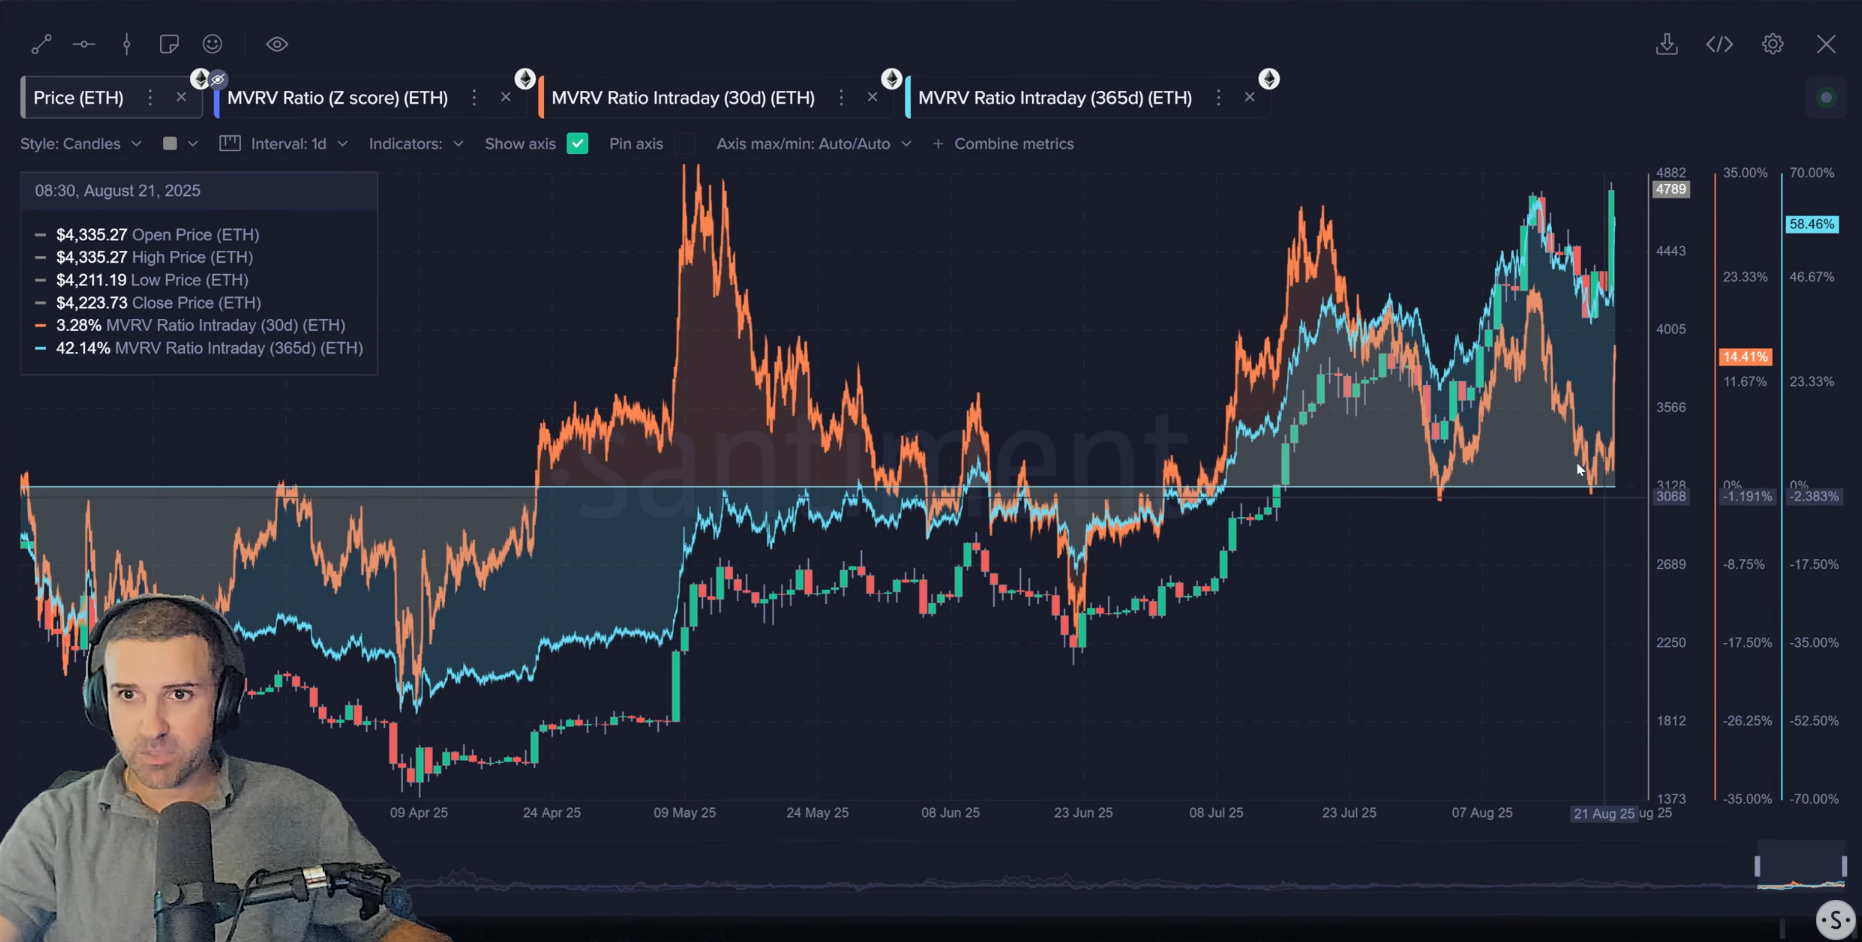
- Key Data: Ethereum’s short-term MVRV is near +15%, while its long-term MVRV is at a very high +58.5%.
- Actionable Tip: Use the MVRV ratio as a risk gauge; when it enters a “danger zone,” it may be a signal to be more cautious about entering new positions at those levels.
Despite the risky MVRV, other on-chain metrics for Ethereum paint a very bullish long-term picture. The Mean Dollar Invested Age(chart) is dropping sharply, indicating that long-dormant coins are re-entering circulation—a historically bullish sign. Furthermore, Network Realized Profits are spiking, and the supply of ETH on exchanges continues to fall, suggesting a strong preference for holding.
- Key Data: Ethereum’s Mean Dollar Invested Age has dropped 6% in the last month and a half, while its supply on exchanges continues to decline.
- Actionable Tip: Differentiate between short-term risk indicators (like MVRV) and long-term health signals (like Mean Dollar Invested Age) to build a more complete market view.
Chainlink received a special mention for its outstanding performance. The asset has been decoupling from the rest of the market, charting its own path upward. The price reached $27.11, its highest level since December 2024, marking a new year-to-date high and generating significant excitement among its community. Here are some good LINK related charts you can save: LINK Active Addresses + Network Growth, LINK Active Addresses, Whale Tx + Pos/Neg Sentiment, LINK Exchange Supply + Whale Transactions, and LINK 100K-1M Wallets
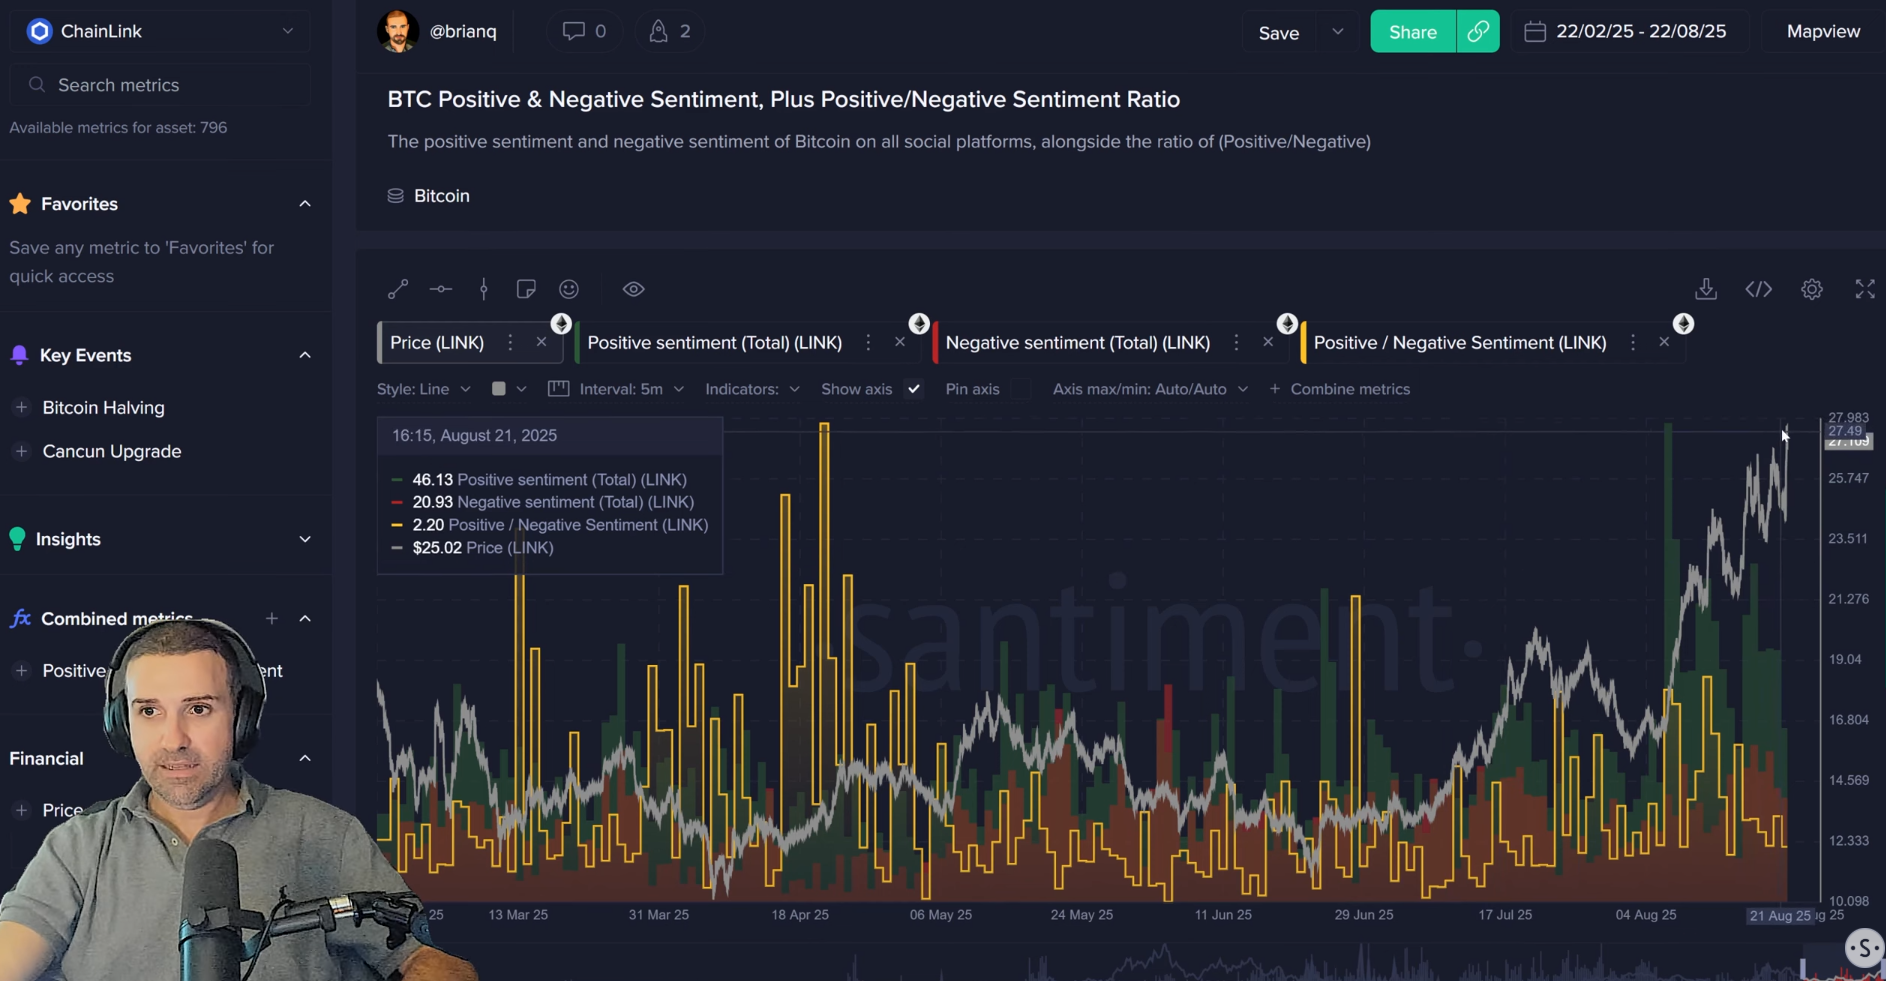
- Key Data: Chainlink’s price hit $27.11, its highest point in over eight months.
- Actionable Tip: Look for assets showing “decoupling” strength (making gains while the market is flat or down) as they can be potential leaders in the next market phase.
Brian showed off the Activity Matrix, a powerful model for identifying market anomalies by ranking assets on on-chain and social metrics. Assets marked “hot” (red), like Chainlink and API3, are seeing peak levels of activity, which can sometimes signal an impending trend reversal. Conversely, “cold” assets are seeing very little activity.

- Key Data: The Activity Matrix combines 8 categories of on-chain and social data to rank assets; Chainlink and ICX currently rank as the “hottest” networks.
- Actionable Tip: Make a copy and enable the activity matrix for yourself to find assets with high network growth but low social dominance, as these could be undervalued opportunities.
In Brian’s final thoughts, the analyst suggested that Ethereum has a good chance of breaking its all-time high and pushing toward $5,000, especially since widespread FOMO has not yet set in. However, the biggest risk to the market remains the narrative around the Fed. If any news emerges to contradict the rate cut expectation, the market could see a swift correction.
- Key Data: A potential price target of $5,000 for Ethereum was mentioned, with the primary risk being a change in the Fed’s stance.
- Actionable Tip: Create a watchlist of key macroeconomic and political events, as these external factors are currently major drivers of the crypto market.
This week’s livestream highlighted a market at a pivotal moment. The rally is being driven by macroeconomic optimism, but on-chain data presents a more nuanced picture with both bullish and bearish signals. Ethereum stands on the verge of a historic milestone, while sentiment indicators suggest that the crowd’s behavior remains a powerful tool for analysis.
By looking at data like MVRV, exchange flows, and social activity, we can gain a clearer understanding of the forces at play. This data-driven approach is essential for making informed decisions in the dynamic world of crypto.
What are your thoughts on a potential Fed rate cut? Let us know in the comments below, and be sure to subscribe to our YouTube channel, our Substack, or follow us on Santiment Insights for more weekly insights into the crypto market.